Understand frequency response, impulse response, phase, etc.
Instructions for performing the measurement
The prerequisite of the following sections is that the data originate from a correctly executed measurement. Before starting the measurement, the elementary rules for setting up loudspeakers should in turn have been taken into account.
Hifi apps guide you step by step through the measurement. It is possible to decide how many microphone positions should be measured. In an average living room, where the listening positions are no more than 2 m apart, two or three measurements two or three measurements often already give an overview of which measures make sense. The microphone should be located where the listeners' ears would otherwise be.
What will be better with more measurements?
If possible, several setups of the speakers and listening positions should be compared. For each setup again at least 2 to 3 measurements should be made. Sometimes significant improvements already arise from changes in the range of 50 cm.
A better, but also more complex way is a so-called sound field measurement: Instead of rounding within a measurement over adjacent frequencies (smoothing) several (over 10) measurements in a range of perhaps 50 cm are made and the (less strongly rounded) frequency responses are interpreted together. The result will certainly not knock down the results of other measurements, but will provide additional precision for fine-tuning a sound processor or equalizer.
More microphone positions naturally make the result more precise when more listening positions are involved. For rating the listening experience, measurements are generally taken only at (potential) listening positions. Measurements at other microphone positions have an indirect benefit: If there is more interest, a complete matrix of the room, e.g. at ear level with 1x1 m grid, can be recorded. In this way, one obtains a deeper understanding of the entire wave field in the room and can plan specific damping measures and the positioning of sound sources and listening positions.
Hifi-Apps are written in such a way that, with little effort, a high number of measurements can also be made: Determination of the microphone position and saving the results are automated. The Android devices can easily be carried around the room, since there is no need for the external power supply as well as the external audio interface.
When you start the app, you will be prompted to connect the Android device to the playback system via cable, if possible. Practical experiences for different types of connections:
- Bluetooth: You should not lump all protocols and devices together. However, it does happen that frequencies above approx. 4 kHz are lost during measurement. Then please don't give in to the temptation "... you can actually still use it".
- Jack plug: Works well, but some devices filter out very high and very low frequencies. filtered out, see here. The low bass range below 40 Hz can be distorted by this, but matching subwoofers works without problems in practice.
- USB: The best solution. With USB C, the analog headphone signal can also be output via this connector (depending on the device). Where the D/A converter is located depends on the configuration, but the measurement results do not significantly depend on the converter used. Caution: Some devices do not switch reliably to the external source. At the beginning of the measurement a microphone test is offered together with the possibility to explicitly set input and output. If a measurement microphone is used this step should not be skipped! The display should response clearly when tapping with the finger on the microphone's basket. Otherwise, the internal microphone may still be in operation.
Initially, it is also possible to work without measurement microphone, see here. This introduction assumes that the measurement was made with an omnidirectional microphone. This has become established because different measurements would otherwise hardly be comparable. For those interested, there is of course nothing to stop them from experimenting anyway, e.g. with so-called 3D measurement methods [Protheroe 2013]: For the app, it does not matter where the data come from. In principle, directional information is of course useful in practice: The search for interfering reflections can and should be supported by clapping and (directional) listening (see below).
In the following steps, the app guides you dialog-based until the measurement is started. The Farina algorithm used is relatively insensitive to ambient noise during the measurement. It In practice, it is even used shortly before the start of a concert with a waiting audience. Nevertheless, if necessary it is a good idea to bring loudly rattling objects under control and repeat the measurement.
The measurement must be performed at moderate volume: The measurement signal puts considerably more strain on the ears and loudspeakers than music of the same volume. Some professional acousticians wear hearing protection for every measurement.
Setup settings (for advanced users)
In the setup menu the duration of the log sweep and its cutoff frequencies can be set. Since the sweep is faded in and out slowly for technical reasons (Blackman windowing 0.05 s leadin, 0.005 s leadout), the frequency range that can be used later is somewhat narrower. 20 Hz as start is sufficient to find resonances in rooms up to 8 m length. The upper cutoff frequency helps with various length measurements from the sound runtime, 20 kHz are proven in practice. Whether the loudspeaker covers a wider frequency range according to the manufacturer does not matter for the important part of the measured values.
The duration determines the precision of the measurement. It should be long enough to give interfering room resonances a chance to resonate and thus be found in the results. To excite a room resonance, the sweep must be long enough in its frequency range. A good start is 2 seconds. Example for technicians: For a room mode with 300 ms rise time and 1/3 octave bandwidth vs. 10 octaves for the sweep, you get 300 ms * 1/(1/3) * 10 ≃ 10 seconds. This is the highest value that can be set. If someone deliberately uses short sweeps to create optically nice straight frequency responses with the accompanying poor resolution, they should probably look around for another field of activity.
The sample rate can be specified in the setup menu. The app receives the offered values from the Android system of the device, as well as the information "native" for a certain value, usually 48,000 per second. This value should not be changed without concrete reasons (see below in the section "Impulse response"). High values ("a lot helps a lot") are not helpful per se.
Evaluation of the frequency response
 YouTube.com: DE 2. Room Acoustics Meter: Frequenzgang
By "frequency response", (FR) and SPL (Sound Pressure Level) is meant here the sum frequency response, i.e. the sound pressure with which a certain frequency at some future time arrives at the microphone after it has been fed into the system. Thus, both sound emitted directly from the loudspeaker and reflections from the walls, etc. are included. To get an overview of the room properties, this is a good start.
Side thoughts on the sum frequency response and
The view of the sum frequency response is unusual at first: Compared to the manufacturer's loudspeaker measurements, much larger fluctuations occur due to the room properties. Manufacturer's loudspeaker measurements usually show only the direct sound - the user's room is, of course, not known at the time of the measurement. Sometimes the measurement is really done outdoors. The sum frequency response in a listening room has hardly anything to do with the characteristics of the loudspeaker. Both frequency responses have their justification and are reflected in the listening impression: A balanced behavior in direct sound can be seen as a basic requirement, similar to the way the light source in a projector must provide white light. In Background knowledge is described, which sonic characteristics are to be expected with which characteristics of the room. Our sense of hearing is apparently able to separate the first direct sound from the loudspeaker and the reflections in such a way that not all these fluctuations are important.The sum frequency response should be oriented to a target curve that drops a few dB to higher frequencies [Møller 1974], [Toole 2015], [Web search "Target Curve spl" or "House curve spl"]. The app offers the possibility to show some established target curves.
Prerequisite for the interpretation are correctly performed measurements (see above). The results should resemble the curves shown here.
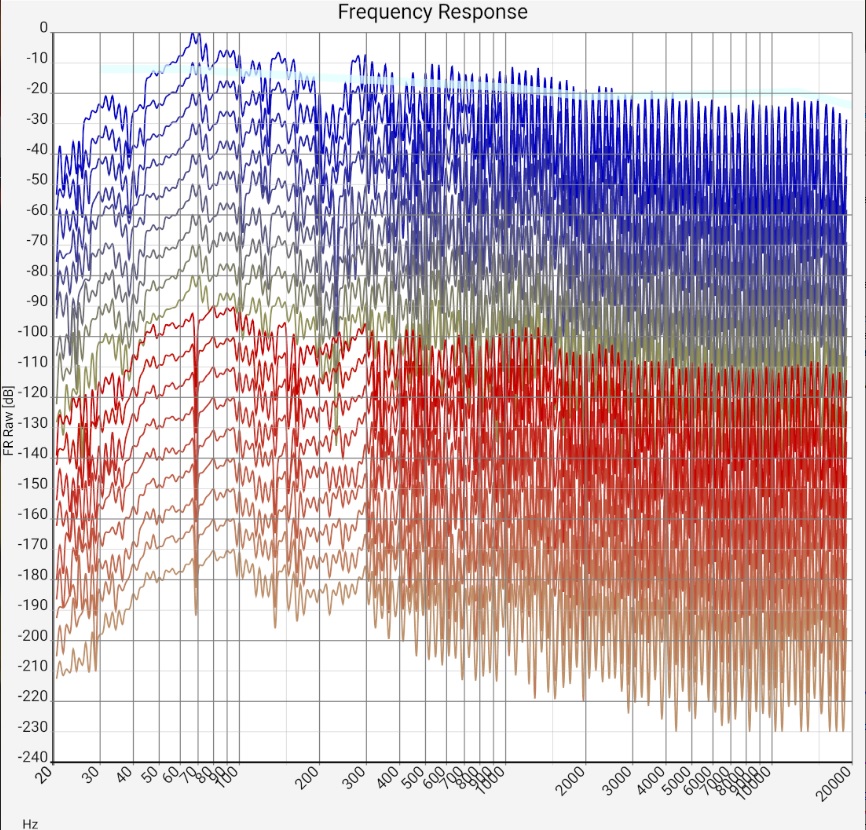
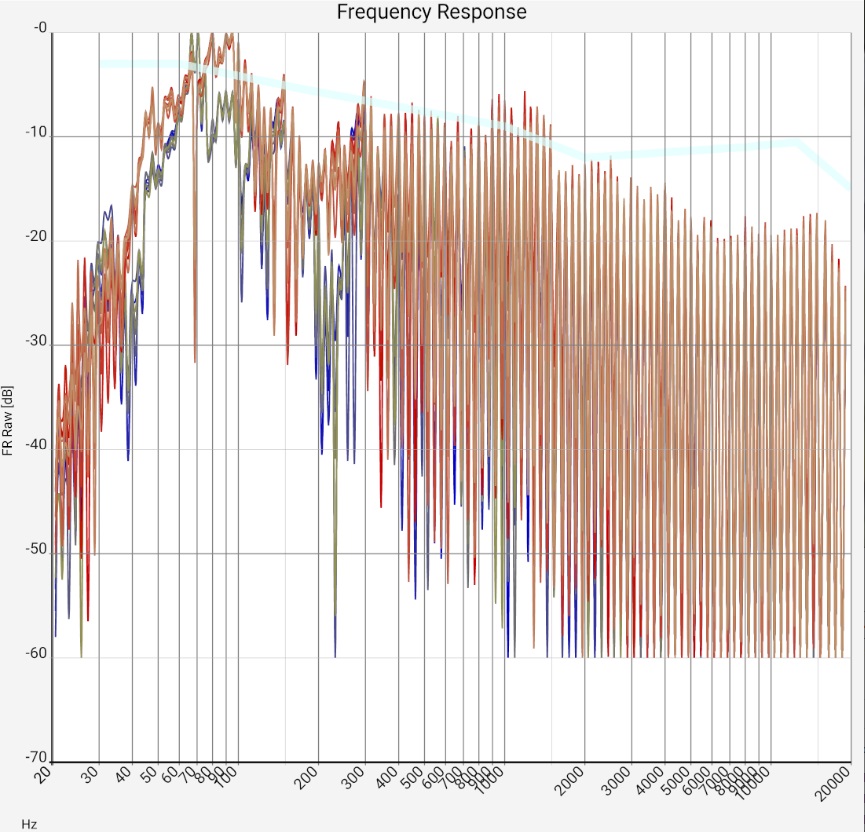
Left column - (almost) universal: For an intuition where the data comes from and what accuracy can be expected, it certainly doesn't hurt to look at a few unfiltered frequency responses at the beginning. Later this step can be skipped. The extreme fluctuations above about 300 kHz are caused by reflections. In open air measurements and in the near field of the loudspeaker they are very reduced or not visible at all. The strength of this comb filter effect gives an idea of the respective uncertainty in the results: It is debatable to what extent the auditory sense is oriented to the peaks or to the averages. In the case of large fluctuations, a drop in treble after averaging can therefore be a consequence of the rounding method and completely meaningless for the auditory impression. In the example measurements below, these raw data are therefore also attached.
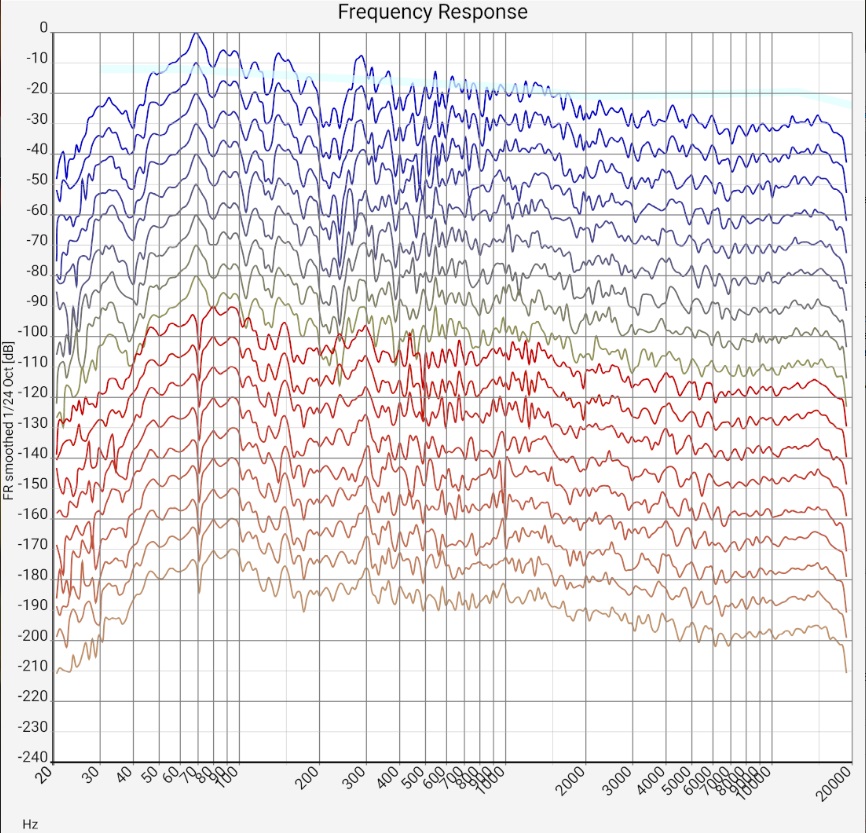
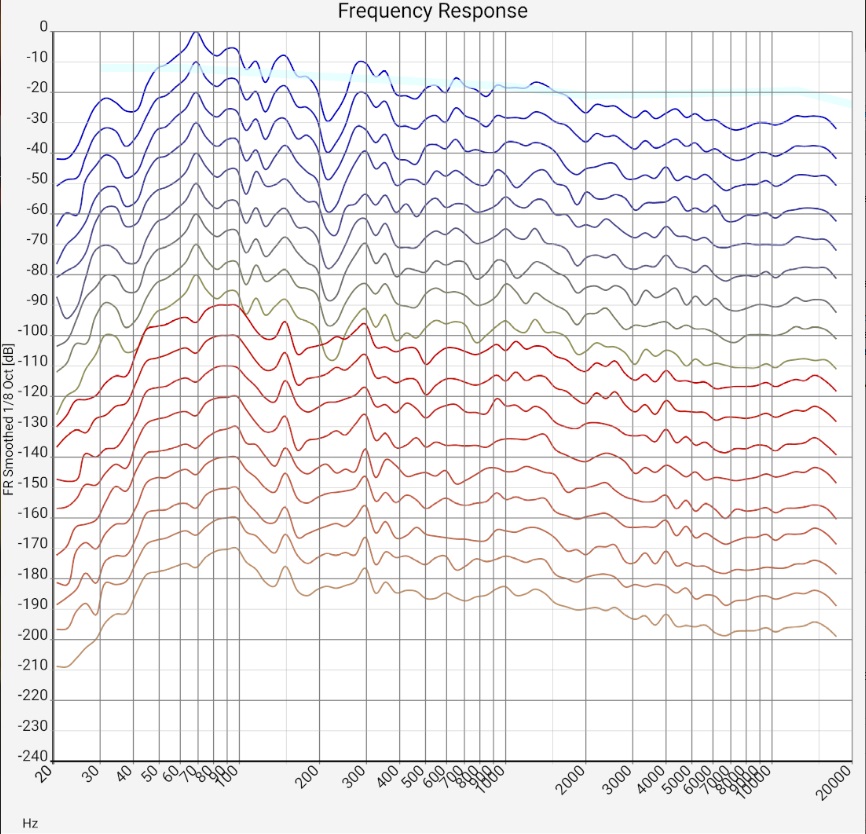
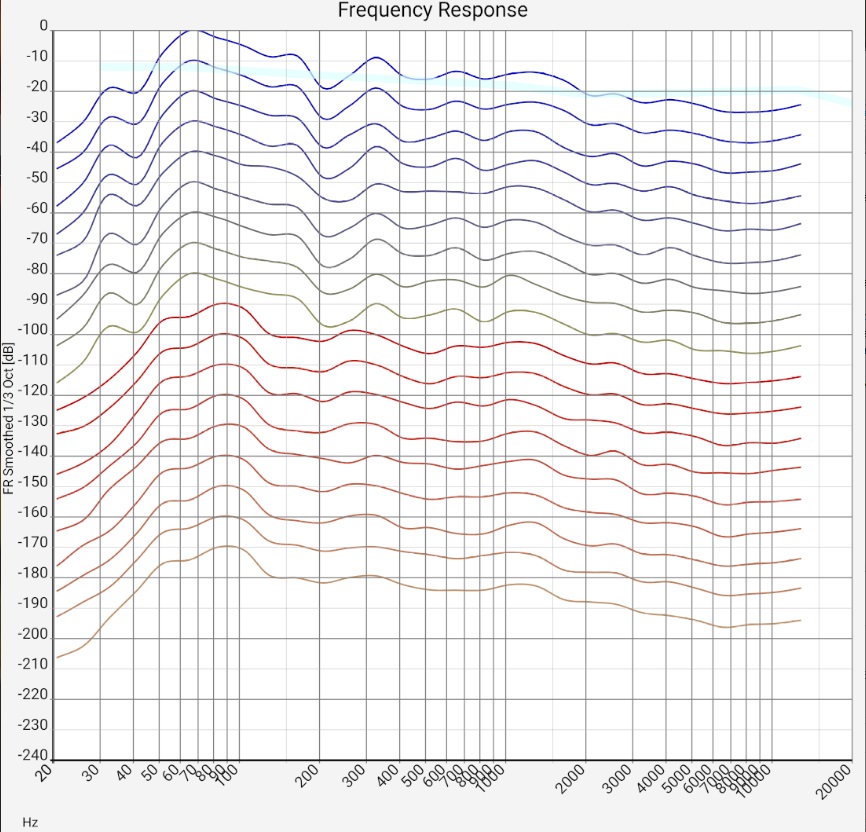
"1/... Octave smoothing" columns - (almost) universal:
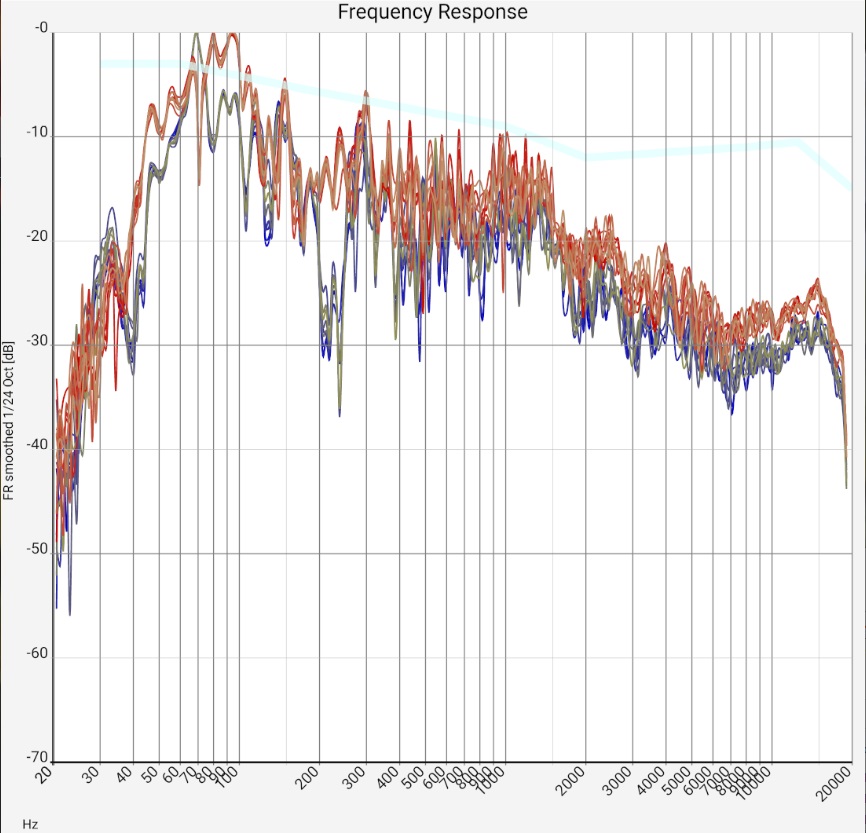
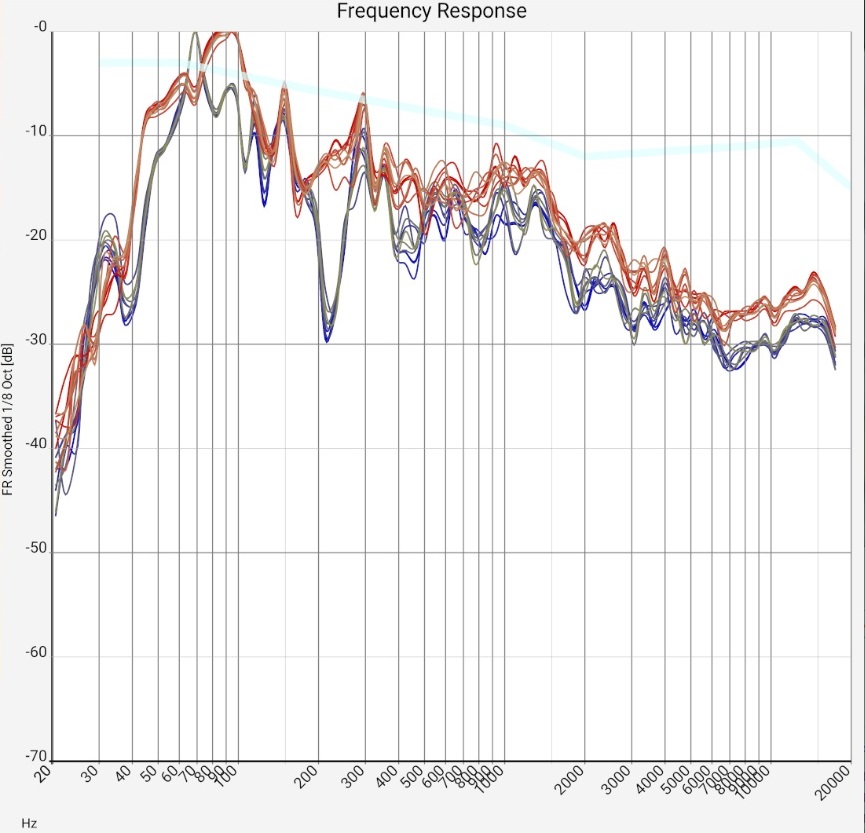
Comparing (in the lower diagrams) first the different measurements (each of a stereo channel), one sees that the values diverge at about 300-400 Hz (i.e. wavelengths of 1 m).
This is plausible because for standing waves maximum and node are 1/4 of the wavelength apart, i.e. in the range in which the microphone was moved. The uncertainties are about 5 dB.
Zwischen eng (≪ 1/3 Oktave) benachbarten Frequenzen innerhalb jeder einzelnen Messung treten ebenfalls Schwankungen von ungefähr 5 dB auf.
Obviously, above about 300 Hz, the wavelength-dependent gains and cancellations due to small changes in microphone position are very comparable to those due to small changes in frequency.
In the range below 300 Hz the measurements are more similar. However, the individual measurement curves fluctuate more strongly at some points.
Whether this is caused by reflections or room modes cannot always be seen in the sum frequency response.
These effects occur with practically all sum frequency responses of normal living rooms. With a higher direct sound component (see below), the fluctuation range can fall below 5 dB, which is desirable. With favorably placed (and driven) subwoofers or fewer reflections due to a more suitable floor plan, the peaks in the range below 300 Hz should be much more moderate. The additional effort for sound field measurements, i.e. averaging over many closely neighboring microphone positions, is only worthwhile in rare cases. Averaging over neighboring frequencies leads to very similar results in the upper frequency range, and in the lower frequency range the measurements are similar anyway. Some sound engineers, for example, use this method only for a final last adjustment of the sound correction for a specific listening position.
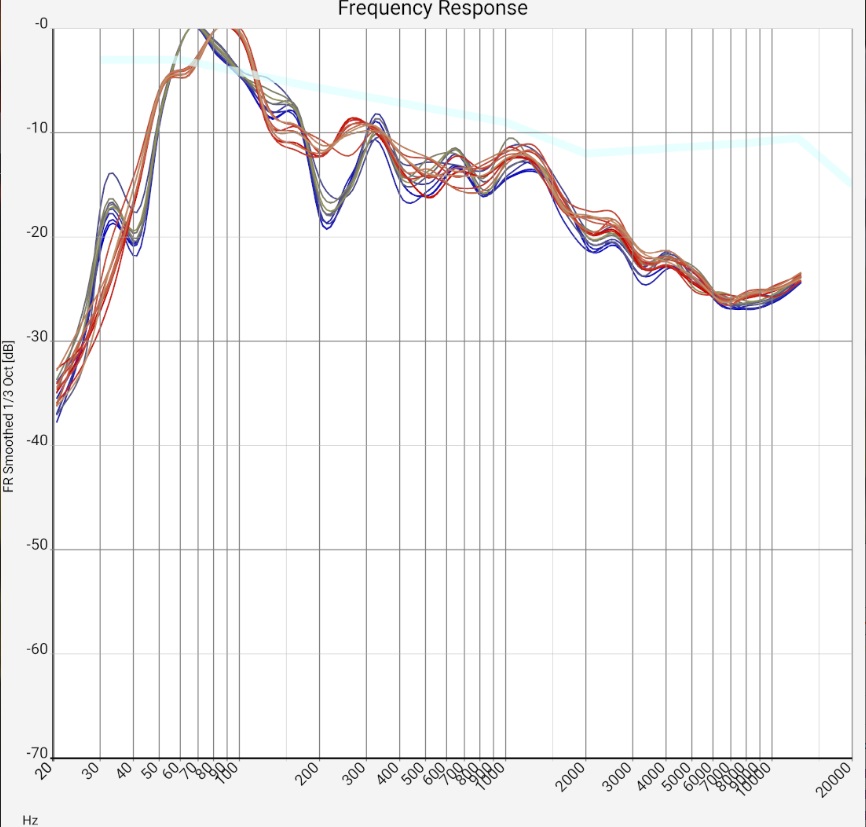
Qualitatively generalizable: Both the 5 dB fluctuations of neighboring frequencies and the much more pronounced room modes or reflections in the bass range show that the room still has "some room for improvement" acoustically, but is not "catastrophic". As with many wave patterns in nature, it is the overall picture that counts; the individual fluctuations have little significance as long as they are evenly distributed. Basically, not every reflection is bad. However, the frequency response smoothed over 1/3 octave should definitely have fluctuations below 10 or maximum 15 dB. If they are evenly distributed, they are less of a problem. Setups in which a few frequencies stand out very prominently should be subjected to a listening test. Positioning of loudspeakers, listening positions and damping with a balanced response will probably sound better.
- The peak at 35 Hz indicates a room mode. Although the speakers reach their limit in this range, it is clearly evident. Measures: From this you can already guess that the use of a single subwoofer is probably pointless. The 35 Hz mode, together with the peaks just below 100 Hz, will unbearably dominate the sound image and when trying to prevent this by clever setups, some other room mode will certainly be played. (Currently, 4 subwoofers are therefore in use, which are controlled via a sound processor).
- Another reason can be a subwoofer of the lower price range: Its resonances may have been designed to be strong and correspondingly narrow-band - with the goal of producing as much noise per money as possible.
- The narrow peak at just under 70 Hz in the left channel and the broader peak at 80-100 Hz in the right channel are audible as a growly, muddy bass. 1/4 of the wavelength here is about 1 m. Measures: Moving speakers or listening positions by 0.5...1 m may provide some help. Unlike the "subwoofer range", where damping can be replaced by additional cleverly controlled speakers, damping would actually be required here. However, for this frequency range, the material cost is quite high. If the effect is similar for all listening positions, an equalizer could be tried.
- The emphasis on the range up to 300 Hz creates a listening experience "as if there was a blanket covering it". Only close to the saturation level do the speakers "open up and become live-like". Measures: Like the previous point, this suggests a moderate electronic lowering of this range.
- The lowering of the treble from 1500 Hz may also be due to the measurement or rounding method (see above). The values can change significantly if the tweeters are aligned with the microphone or the distance between the loudspeaker and the microphone is smaller. Depending on the target curve, room characteristics and personal experience in handling the measurement equipment, it should not be corrected blindly. If one were to increase the level here by 15 dB, the result would be (briefly, until the ribbon tweeters burn out) a terrible sound image.
-
Floor bounce is not noticeable here, but can be found further down in the sample measurements.
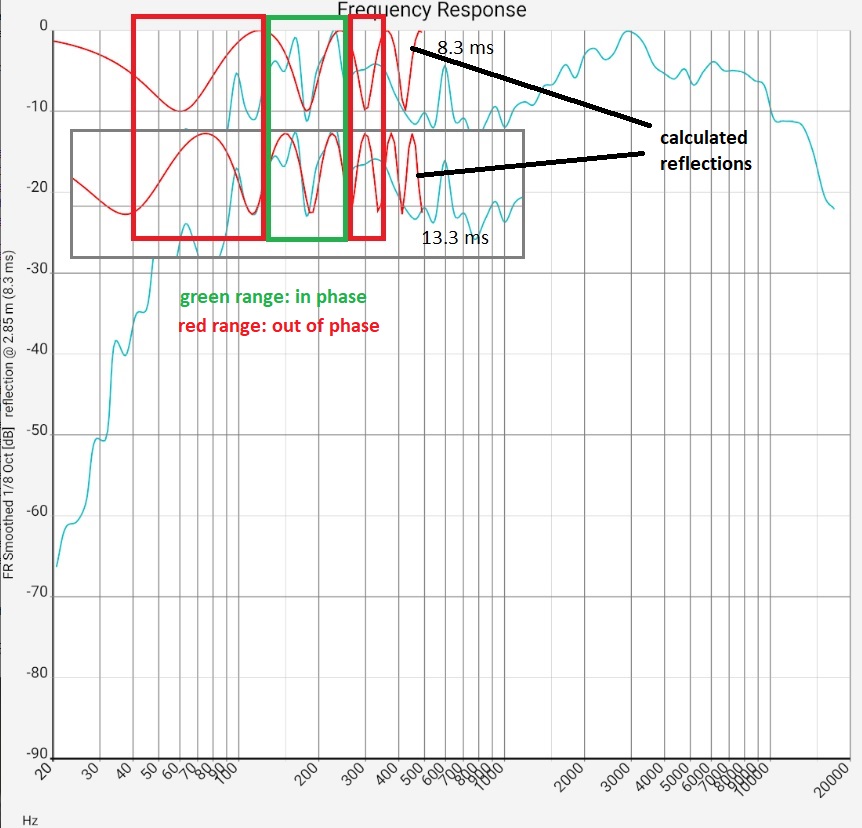
They can clearly disturb the auditory sensation. If the frequency response shows an m-shaped curve, it can be checked as follows whether a reflection is the reason.
- Open the overlay with SET
- Switch Sie REFLECTION to ON.
- Use the 3 sliders ↣ ↕ ↑ to position the calculated reflectance curve over the measured values.
Nur only if this is possible, it is a reflection. For technicians: Otherwise, the respective frequency maxima have no integer ratio of wavelength to detour. More. - Downward fluctuations in the bass range up to about 150 Hz are probably due to mutually cancelling waves. Basically, missing frequencies are considerably less noticeable in the listening experience than boosts. At least as long as the system is not used for mixing your own productions and these are then overcompensated. Attempts to eliminate them by moving the speakers usually creates new fluctuations. However, it is definitely worth comparing several measurements and finding "the least evil".
- The evaluation of the entire 1-octave smoothed response assumes that a) the microphone has been calibrated. Above about 5 kHz, at least some experience should have been gained with different arrangements of microphone to tweeter. Measures: The frequency response can be compared with the different target curves (see above) and a house curve can be selected.
- Regardless of the previous point, the entire 1-octave smoothed curve can be used to compare tendencies - e.g. whether different channels (Right Left, Surround) show significant differences. This also works without a calibrated microphone. Of course, a microphone with a directional pattern must not favor any loudspeaker. As described above, the measured values have nothing to do with the frequency response of the loudspeaker.
The broader increases and decreases in the frequency response can be assigned to certain sound characters. This can contribute to the understanding of a listening test. If neutrality is not the goal, it can be incorporated into corrective measures. Search engine queries "sound character vs. frequency response" yield interesting findings, some of which are summarized here from the author's personal point of view:
| All frequencies in Hz | 20-40 | 40-200 | 200-500 | 500-2k | 2k-6k | 6k-12k | 12k-20k |
| Important to | Feel vibrations | 100: beginning of the deepest human voices 150: warmth of sound, body of voices | 200: foundation of the human voice | sensitive area of hearing. For guitars and voices | most sensitive area of hearing. Clarity, proximity of voices. | brilliance, openness. Cymbals, strings | for sparkling brilliant transparent treble. Cymbals. |
| Sound at boost +10 dB | Depending on listening experience and taste | 40-60 boomy, 100: bass muddy, but 60-150: boost for fullness in the bass range, fat sound, 125-250: "as if there's a blanket over it" | 300: potted... 600: dull, honky, hollow | 500-2k "old kitchen radio". 1k: nasal, thin, 2k: thin, harsh | 2k-6k: "megaphone sound". 5k: sharp, hissing | 7k: unpleasant "s" and "t" sounds, web search: "de-esser" | . |
| Sound at -10 dB lowering | Too bad | 150: bass seems disconnected | 250 bass seems hollow, 450: voices seem hollow | 1k: lower about 5 dB to "de-mulmerize" | 2k: clarity lacks 3k: "attack" Missing, cloying, romanticized 4k: finesse lacks | . | |
| Blauert | 300-600: front | 700-1800: behind | 2,2k-6k: front | 8k-11k: above | 11k-17k: behind | ||
The sensations in lines 2-4 do not satisfy any scientific requirement, they are certainly not systematically reproducible. If single frequencies are indicated, a range of 1 to 2 octaves FWHM is meant. The last line refers to the so-called Blauert bands: By raising certain frequency ranges, one can create the auditory impression that the sound comes from the front, above, behind or below [Blauert 1974, Wikipedia].
Side thoughts about smoothing
The question which smoothing is the most meaningful for what fills many forum pages. Basically (for sound field measurements - see above) can be averaged over several measurements, or the averaging is done over the frequency response, where again there are several methods. Before reading, one's own intuition should be created by switching (especially between 1/3 and 1/8 octave smoothing) what is to be seen in each case. As a basis, the raw data should also be viewed. Both the average sound pressure and the maximum sound pressure of each small frequency range go into the perceived loudness.
For the listening impression, the trends in the superposition of direct and reflected signals at the microphone or ear are important. Even in the smoothed data, the resulting individual peaks should not be overinterpreted: Their position also changes depending on the microphone location. In addition, listeners change their sitting position and have about 14 cm distance between the eardrums. It is important that this does not change the sound too much. There are two basic ways to realize this:
- by a high direct sound component. For this purpose, studio technology offers near-field monitors. The listening distance is usually less than 2 m. The more the room is damped, the less critical the listening distance. Horn loudspeakers also allow greater listening distances.
- by ergodicity, i.e. good mixing, so that as far as possible all frequencies are reflected at all times from the correct directions. Omnidirectional or dipolar radiating loudspeakers certainly "get things off to a good start" if such sound distribution is preferred.
Rarely mentioned is channel equality. It has at least the same priority as the frequency response: A system in which singers are not located, or worse in a completely wrong place, cannot seriously be called "calibrated". Channel equality has to do with the equality of the frequency responses of the right and left channels, but many other effects enter into it as well. Initially, listening tests are certainly the better way to evaluate.
Evaluation of phase, delay, group delay
While the frequency response shows how strongly a certain frequency is reproduced, these curves show in different forms when it is reproduced. Not all frequencies always arrive at the same time: An example from nature is the crackling of ice on a frozen lake: from some distance, the "crackling" sound changes to a kind of "piu" because the higher frequencies of ice are transmitted faster. Auch beim impact of lightning, the low-frequency thunder often arrives later than the bang of the impact. However, unlike breaking ice, whose behavior can be physically understood, many factors that are not precisely known interact here. For distant explosions, for example, the time evolution is completely different.
The behavior of sound in living spaces is more like the second example. Only partial aspects sometimes seem explainable by concepts like bass reflex channels. Without measures at the room acoustics one probably does not need to deal with it. After that, certainly in the high-end range, otherwise maybe. A recipe for understanding the curves is already elsewhere.
Evaluation of the impulse response
 YouTube.com: DE 3. Room Acoustics Meter: Einführung in die Impulsantwort
Roughly speaking, impulse response (IR) is what you hear when a sharp bang is played. It characterizes echoes, reflections, reverberation, etc. in the listening room as well as the reaction of the loudspeaker cabinets including the associated electronics. Instead of the bang, Hifi-Apps play a more tolerable logsweep and reconstruct the data of the bang from it.
Before dealing with the measured impulse response, it should be intuitively clear what it is all about. For this, you can clap your hands in different rooms and hear how the reverb decays. The ideal listening room must be neither "completely dead" nor reverberant like a bathroom. The reverb should also be evenly distributed in the room (e.g. not bounce back and forth between facing walls). With a little practice, this can be heard well. It can help to turn your head in different directions while clapping.
The measured impulse response shows the time course of the sound pressure or a closely related quantity. The x-axis always shows the time, in the case of hi-fi apps optionally also as a product with the speed of sound in meters. The curve can be divided into three parts:
- The peak on the left shows the direct sound. This is the sound that reaches the microphone without detours. Vividly it is the first and most intensive part of the imaginary bang. Its shape comes from the transient of certain parts of the loudspeaker and would be similar in an anechoic chamber. It does not necessarily have to be a single peak, but several oscillations next to each other should not be overinterpreted. Not every spike in this range provides useful information, there are also computational artifacts [Usher 2010].
- Early reflections are often relatively isolated, faithful repetitions of the direct sound. They can also be visible in the frequency response and are already described here.
- Late reverberation. The individual reflections go by more and more reflections into an ergodic state: Descriptively, the loudest part no longer jumps back and forth in space, but has spread out. Except for the loudness of the reverberation, nothing changes anymore. The auditory sense perceives the latter as more pleasant. This is why diffusers are used to distribute sound.
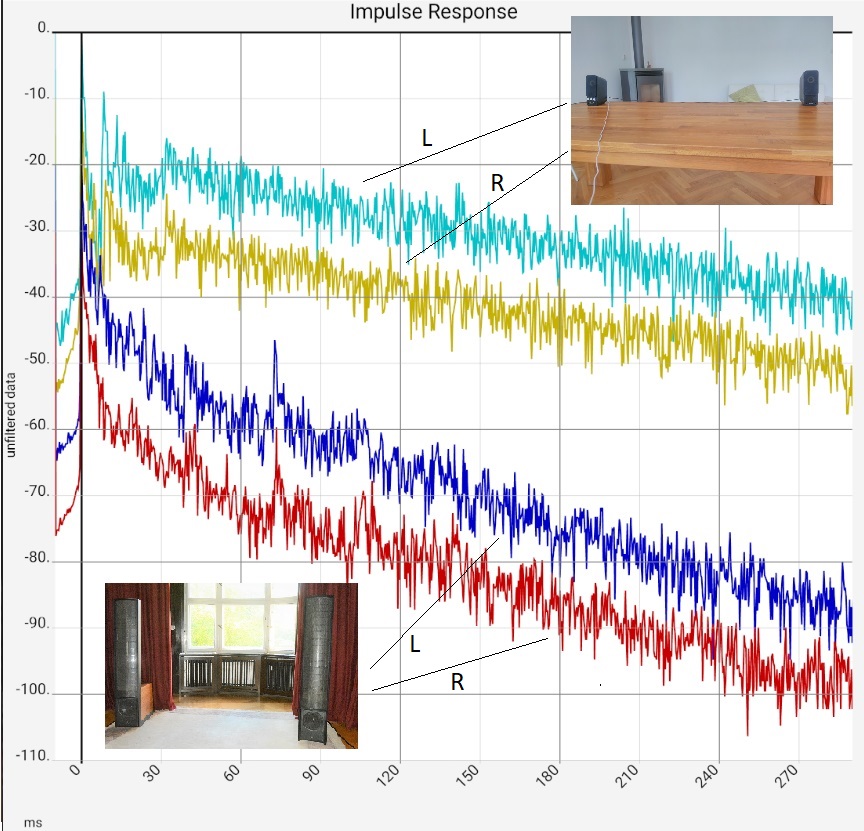
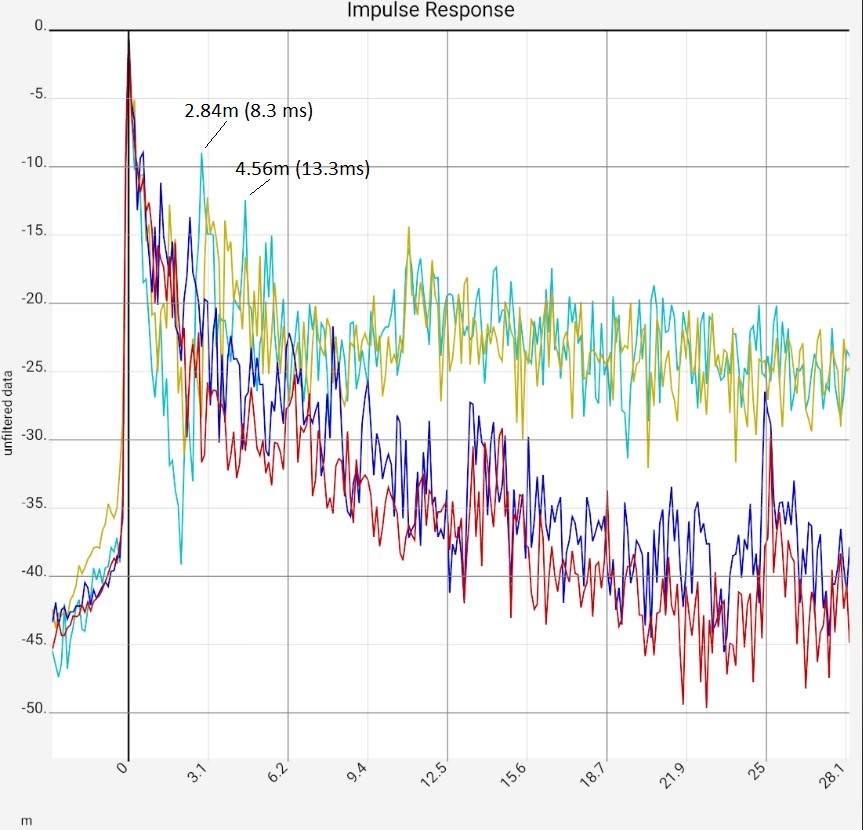
Light blue: As expected, the impulse response of the empty room is so poor that the details hardly need to be interpreted. Nevertheless - column 2: In the magnification, the transient in the first 3 ms and the peaks afterwards stand out in particular. The first two peaks were marked with the sound travel time. Apparently there are two sound reflecting surfaces that reflect the sound with 2.84 and 4.56 m deviation from the left speaker to the microphone. Die akustische Behandlung könnte mit der Suche nach diesen Flächen per Schnur-Methode und ihrer Behandlung beginnen. Um den Einschwingvorgang am Anfang etwas zu verteilen, könnte an Diffusoren gedacht werden. On the other hand, the lower row of pictures shows that the reverberation time is far too long, which speaks more for damping. Presumably, any treatment would be an improvement.
Tolerances of 10 to 20 cm are normal for length specifications, and correspondingly more for large speakers, because the exact location of the sound source is often unclear due to the interaction of several drivers. Similar discrepancies between room size and measured delays should not cause too much concern either. It is probably enough to know that the acoustic size of a room can be up to 20% larger than its architectural size. Especially if the walls are wood or plasterboard and resonate (web search "sound at media boundaries" for more).
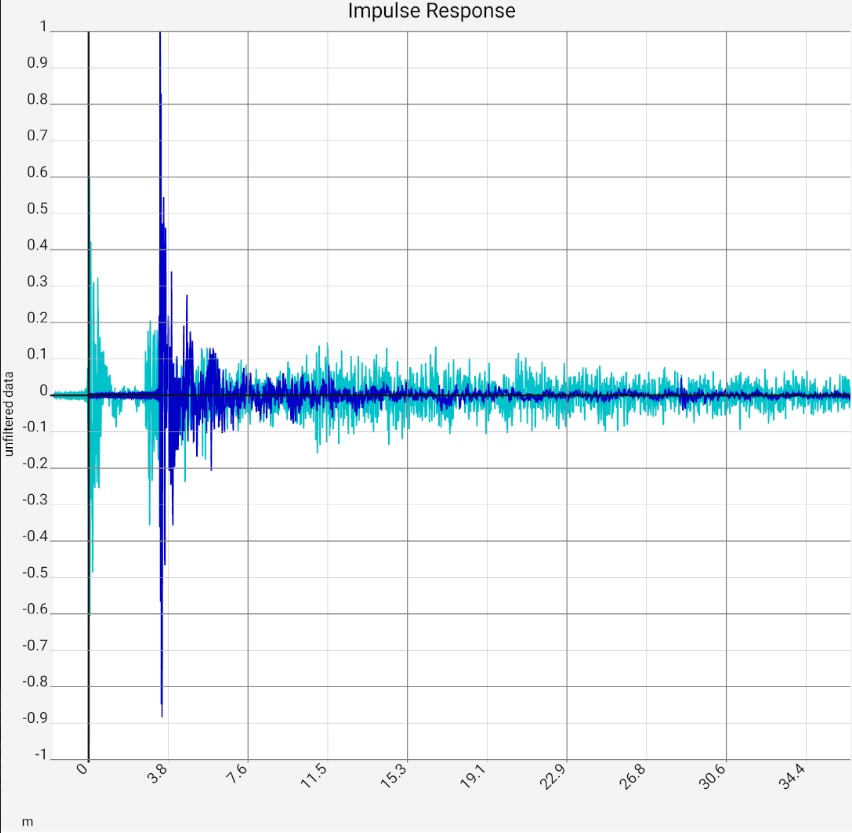
There are several possibilities for the Y axis of the impulse response. Basically in the first step you can choose between linear and logarithmic representation. Since the sound pressure in the impulse response of a living room falls logarithmically over long distances, the latter is almost self-evident. The decrease appears as a straight line and deviations from it become recognizable. The linear representation is closer to the measured raw data. Accordingly, technical details such as the interaction of different loudspeaker chassis are better visible. To view parts with small amplitude, the curve can be enlarged with two-finger gestures.
 YouTube.com: DE 4. Room Acoustics Meter: Geglättete Impulsantwort und Step Response
There is a fundamental problem with both representations: the energy arriving at the microphone for a time period is closely related to the area under the corresponding piece of curve, depending on the representation. Ideally, it is concentrated on a single narrow high peak. In the real world, however, its high-frequency and low-frequency components sooner or later diverge. The high-frequency parts, however, naturally remain limited to a short period of time. Consequently, they are represented by high narrow peaks. The low-frequency components cover a comparable area, but this area extends over a much longer period of time. Therefore they can hardly be seen, although they are much more important for the auditory sense. In forum discussions on room acoustics, a raw or slightly smoothed logarithmic representation is usually posted.
On the other hand, the peaks are a useful indicator to identify individual reflections as accurately as possible. They cannot simply be "smoothed away".
So to understand the system, you should switch back and forth between the representations. The app offers the following options:

- Linear representations
- [RAW] shows the raw data, as in the examples above
- [AVG] shows the smoothed raw data. The sharp peaks caused by high frequency components disappear, thus reflections without high frequency components become better recognizable. The bandwidth of the smoothing can be adjusted with the "Bandwidth" slider. This representation should only be used after viewing the unsmoothed data. Otherwise, different reflections could melt together due to the "smearing" of the peaks. The EBU 3276 standard, for example, focuses attention on spikes in the unsmoothed impulse response.
- [STEP] shows the step response, i.e. the integral of [RAW], i.e. the area collected so far under the curve RAW when it is scanned from left to right. In an ideal system, it would jump from 0 to 1 at time 0 and stay there. In a real system, significant oscillations are visible, but they irritate the sense of hearing surprisingly little. The advantage of this representation is that reflections with and without high frequency components also look similar here, if they transfer similar amounts of energy. An example can be found in the documentation of the ETC (see below).
- [ETC]: The Energy Time Curve, also Impulse Response Envelope is documented here. It shows the instantaneous energy (more precisely: the Hilbert Transform) of the sound field measured by the microphone. In combination with other representations it can help to detect unwanted reflections.
- Logarithmic representations
- [RAW] wie bei "Lineare Darstellungen". Siehe Text weiter oben für den Unterschied linear / logarithmisch. Der begrenzte Platz kleiner Bildschirme kann besser genutzt werden, wenn der untere dB Wert begrenzt wird. Dazu muss in der zentralen Ansicht der App (Hauptmenü) geöffnet werden. Die Einstellung erfolgt unter SETUP/"Range for sound pressure [dB]".
- [MAX] Zeigt die Maximalwerte von RAW (in 0.5 ms Intervallen). Dadurch wird verhindert, dass Ausschläge nach unten Bildschirm-Platz verbrauchen. Dadurch lassen sich auf kleinen Bildschirmen und vielen Kurven darstellen.
- [ETC] as in "Linear representations".
- T60 Method Comparison
- [RAW], [MAX], [ETC] work as in "Logarithmic representations"
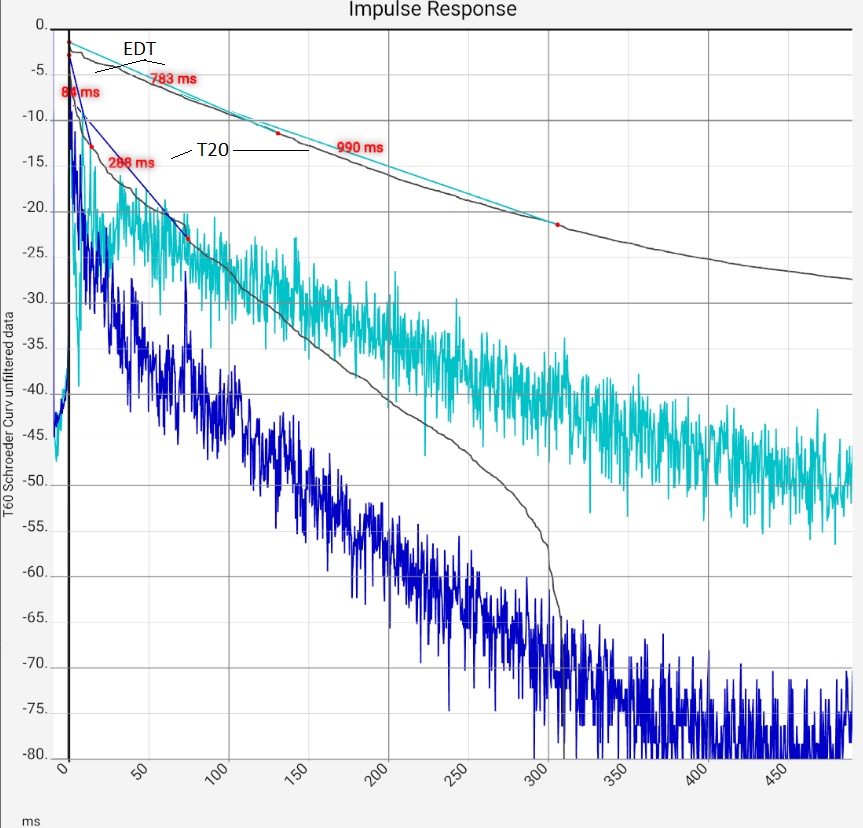
- Schröder Curve: shows the total energy that is still in the sound field. It makes it comprehensible where the calculated reverberation times and their deviations in different methods come from. See text above.
- The reverberation time in seconds shows how quickly the reverberation in a room decays below the hearing threshold (-60 dB). Hifi apps use the Schröder curve for calculation. Depending on the method, two points of this curve are selected and connected with a straight line. The reverberation time is then the time this straight line needs to connect 60 dB "height difference". It therefore depends on which points in the curve are compared in each case. For good localisation, the beginning of the curve is more important, for a pleasant spatial impression later parts. Accordingly, there are several standards that can be selected in the app. The app additionally offers to freely select the start and end point. The basis is either the dB value, i.e. the Y coordinate, or the time value, i.e. the X coordinate. In all cases, both the Schröder curve and the connecting straight line can be displayed. In this way, you not only get the value for the reverberation time, but a more comprehensive picture of where it comes from.
 YouTube.com: DE 5. Room Acoustics Meter: Frequenz gefilterte Impulsantwort
Waterfall
 YouTube.com: DE 7. Room Acoustics Meter: Wasserfalldiagramm und Spektrogramm
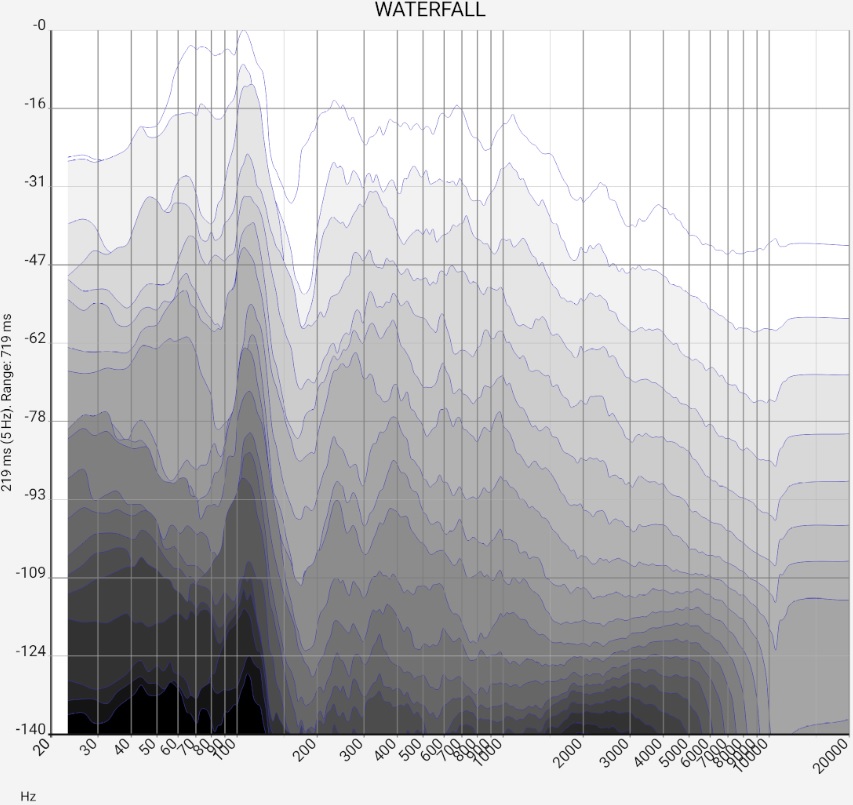
The "normal" sum frequency response shows how strongly each frequency is reproduced, regardless of when it arrives. In the waterfall diagram, as in the cumulative frequency response, the amplitude is plotted against the frequency. However, the incoming sound intensity is chopped up into time segments and thus distributed over several curves. From now on, these are called FR(t), which should represent that they are time-dependent frequency responses. The first FR(t), for example, is the frequency response for the first 5 ms, the next for the next 5 ms and so on. This makes it easier to see whether individual irregularities in the sum frequency response come, for example, from short, intensive reflections or less intensive but longer resonances. Both the audibility (i.e. whether measures against this are necessary at all) and the corrective measures themselves depend on this.
The output is created by calculating the frequency response not from the entire impulse response, but from the section that is to be examined in time for FR(t). Each FR(t) therefore arises from a specific section of the impulse response around time t.
Even an ideal waterfall diagram in an absolutely reflection-free room would not be limited to FR(t=0): If, in the example, the width of the time segments examined were also set to 5 ms (= 1/200 Hz), frequencies below 200 Hz simply could not be defined, as no full period would fit into this time segment. This Heisenberg limit prevents fast bass arias. It cannot be overcome by clever algebra.
For this reason, a compromise between time and frequency accuracy must always be chosen. There are two established methods for this [IRZU FFT WAVELETS]:
- FFT
In the settings overlay, the number of curves is shown together with the temporal position of the first and last curve. Clicking on [CHANGE] enables the change. For this purpose, the view is temporarily exchanged for the impulse response. You can now see the individual sections of the impulse response from which the FR(t) are calculated. The settings for the image above: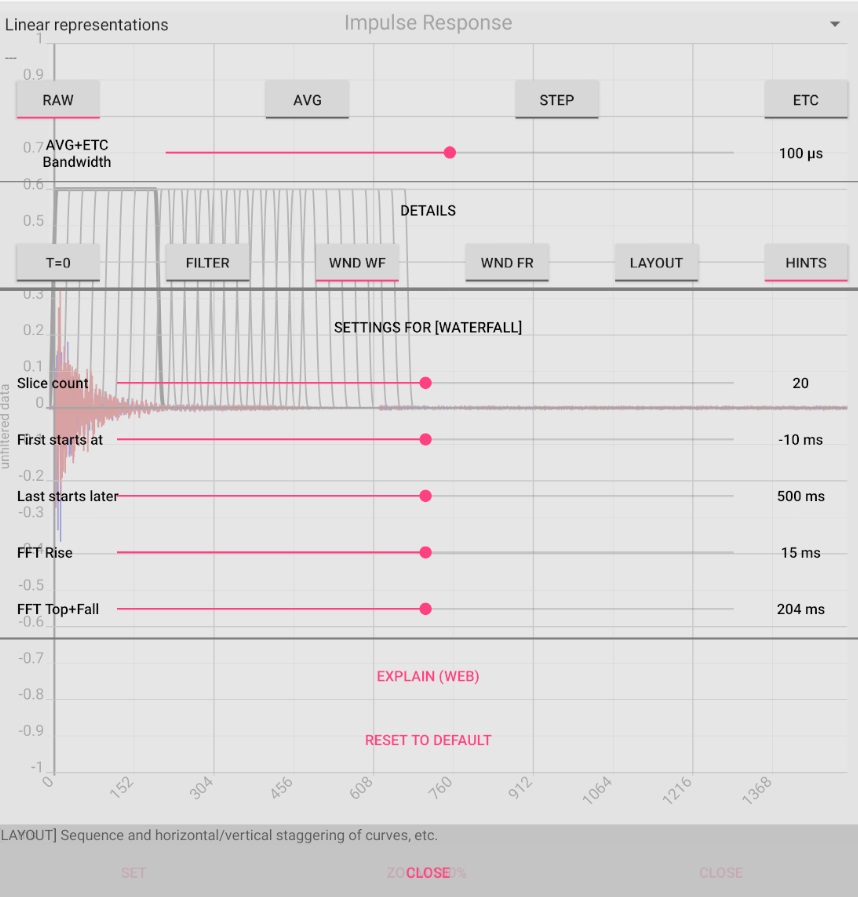 Here, 20 strongly overlapping sections are chosen, the first of which starts at -10 ms, i.e. 10 ms before the main peak of the impulse response.
The last one starts 500 ms later. The trade-off between accuracy of time or frequency is determined by the width of the individual sections.
The last two sliders "FFT Rise" and "FFT Top+Fall" serve this purpose.
The sum of their values (here 15 ms + 204 ms) gives an indication of the frequency resolution, which should be a few Hz.
The sections are therefore chosen very broadly and overlap correspondingly strongly. The temporal resolution is correspondingly poor.
On the other hand, the narrow-band mode at 110 Hz is clearly visible in the picture above.
- Wavelet
This representation fits much better to the output mode [spectrogram] and is implemented here only for comparison purposes with the FFT data. The method clearly places relatively short wave trains with few oscillations (wavelets) on many points of the impulse response. The impulse response is therefore also sampled in pieces. However, this sampling is repeated several times, whereby the frequency of the wavelets is changed. is changed. Their shape remains the same, i.e. at halved frequency their length doubles. As a result, only half as many wavelets are now needed for the entire impulse response. This has the advantage that at high frequencies, where a high high time resolution is possible, many samples are taken in correspondingly short time intervals. At low frequencies, on the other hand, the time segments become long enough to maintain the frequency resolution (per octave).
Example: The wavelet has a length of 5 wave trains. If you give it a frequency of 40 Hz, it covers a range of 0.125 seconds. With some overlap, about 10 wavelets are sufficient to examine the 40 Hz band of the sound distribution in the first second. Theoretically, an accuracy of up to 1 / 0.125 s = 8 Hz, roughly 1/3 octave, is possible. For 80 Hz, 20 wavelets are needed, thus obtaining twice the time resolution with an accuracy of 16 Hz, i.e. 1/3 octave again. At 800 Hz, 200 wavelets can be used, at 8000 Hz 2000 wavelets.The frequency resolution remains at 1/3 oct, the temporal resolution is getting steadily better.
In the app, the settings are theoretically reduced to the accuracy in octaves and the beginning and end of the time range to be scanned. In practice, however, the waterfall diagram must provide curves with fixed time intervals, therefore the number of curves and resolution remain adjustable. The wavelets are then "forced" onto this curve "against their natural resolution". The advantage remains that very small time sections of the high-frequency range are resolved. With the spectrogram representation, this constraint is omitted and the wavelets can play out their advantages considerably better.
Spektrogram
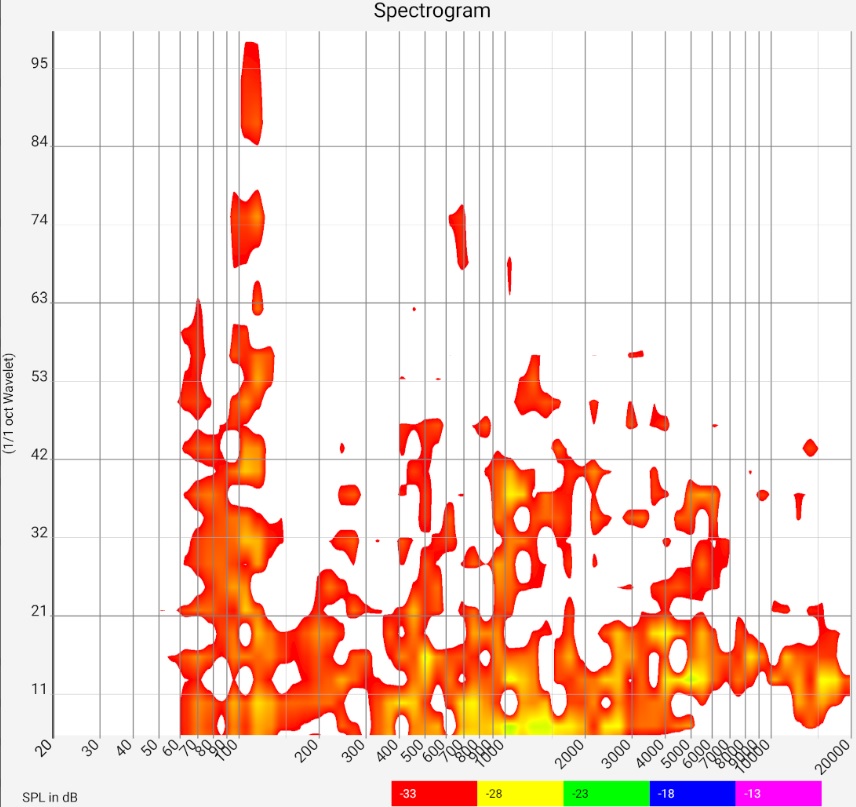
The spectrogram is similar in content to the waterfall diagram. It uses different colors instead of different curves. In both diagrams, one axis is for frequency.
In the spectrogram, the other axis is for time and the color is for intensity.
In the waterfall diagram, the other axis is for intensity and different curves are shown for different times. With these differences in mind, the documentation is the same as the waterfall diagram.
T60
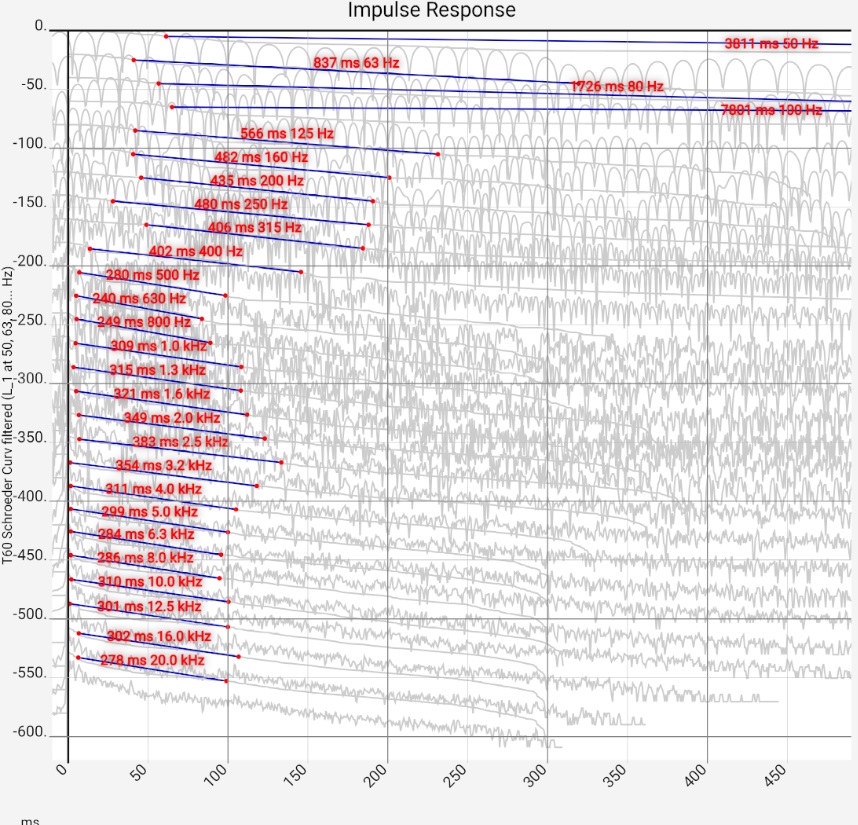
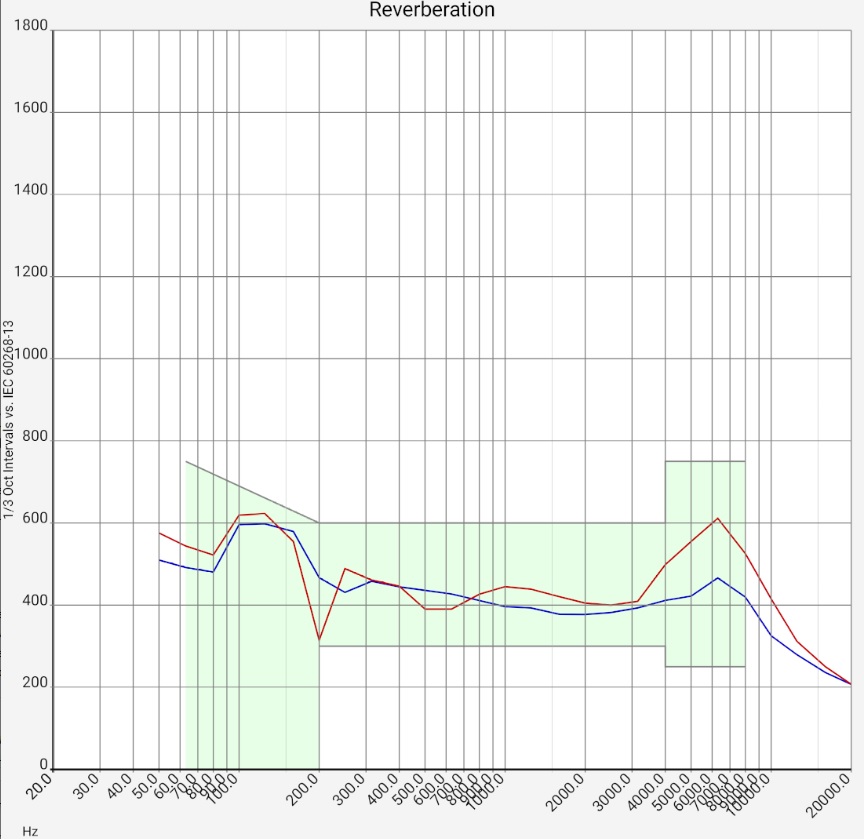
In the Evaluation of Impulse Response section, we explained how hi-fi apps measure reverberation time T60 and presented various filtered impulse responses with associated T60. The calculations here are identical, but go one step further: the reverberation time is calculated with third-octave or octave spacing for many frequencies and displayed as a function of frequency. This allows a direct comparison with common standards. These can be selected and displayed. To calculate the standard values, the room volume must be specified.
The calculated reverberation times in the bass range must not be blindly trusted. As shown in the section "Evaluation of the impulse response", the filtered impulse response there is subject to considerable fluctuations of various period durations. These result from a mixture of chaotic room acoustics (below the Schroeder frequency), which strongly depend on the microphone position, etc., and filter effects. Ultimately, a single T60 value can never fully describe the highly complex behavior of a listening room in this frequency range. Only if its behavior is stable, however, comparative measurements and different evaluations, it can serve as a reference point. In [Zehner Ringversuch] measurements with different 13 acoustics software packages, operated by sound engineers with mostly far more than 10 years of professional experience, are compared.
It is much easier to attenuate high frequencies than low ones. Low frequencies, however, play an important role in word understanding. Accordingly, the reverberation time in the lower frequency range must be kept under control as well as possible. When DIN 18041 was drawn up, compromises were made between acoustic quality and feasibility for the lower frequency range [Fuchs 2019]. In case of doubt, it is therefore better if the measured values lie further down in the range of the standard.
If the reverberation time in the low frequency range is too long, the cause can be investigated in the spectrogram or waterfall diagram. A room mode should be found in the respective frequency band. The elimination in an existing building is difficult. Some approaches can be found here.
Room Acoustics
 YouTube.com: DE 8. Room Acoustics Meter: Schalldruckkarte
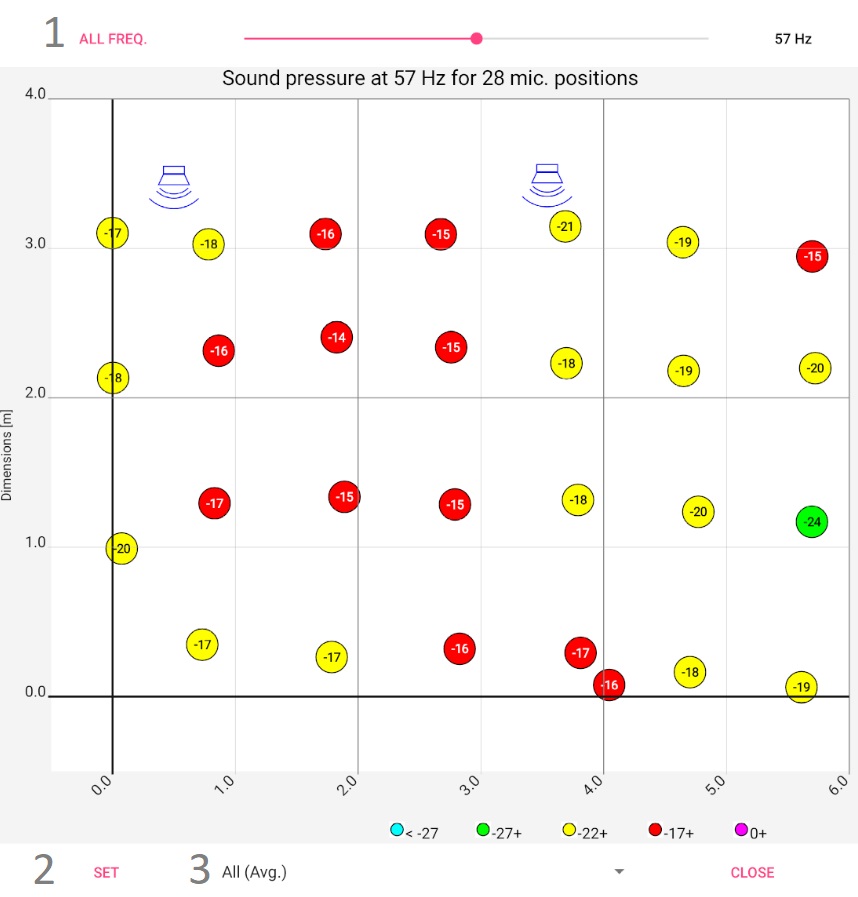
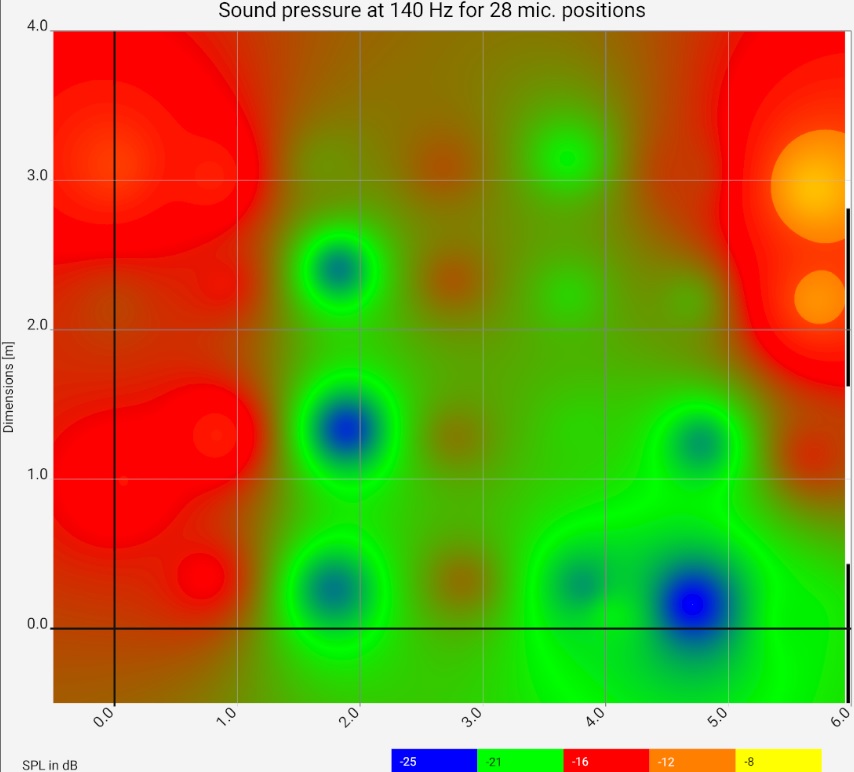
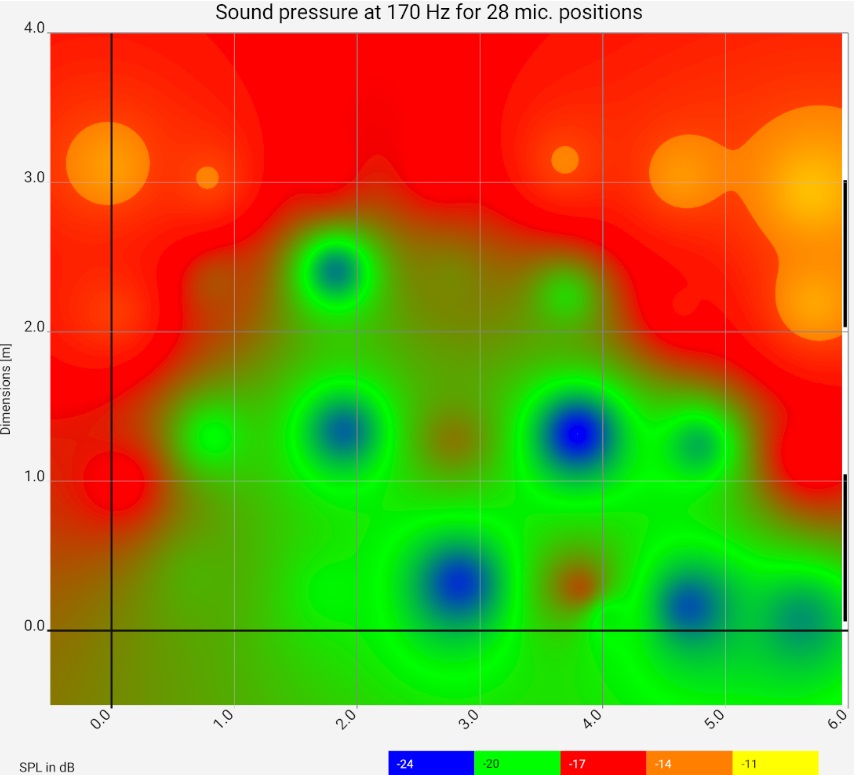
This representation can be understood as a parameterized sound pressure map. Sound pressure maps show how loud it is at the individual listening positions. In private rooms, however, this is not very important; the volume is more or less the same everywhere. The problem is the resonances and reflections that can create a different auditory image in each place. The sound pressure in particular for a certain frequency is therefore much more decisive here. This is exactly where the representation comes in: The sound pressure map is supplemented by a controller with which the frequency can be tuned:
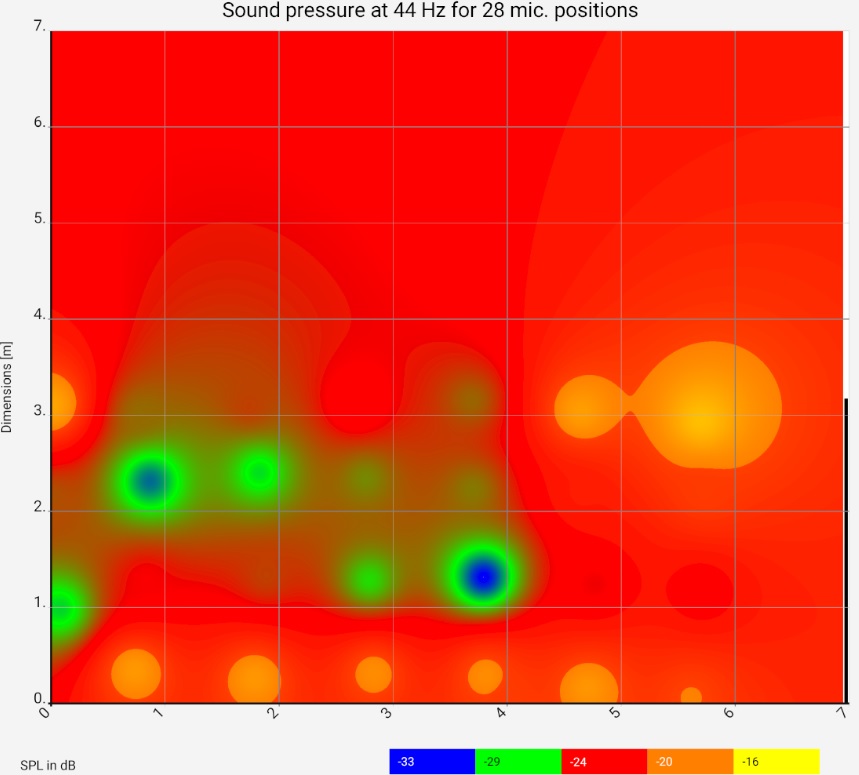
For the example, measurements were taken at 28 places. The graphic shows the floor plan of the room, the red areas are loud for the respective frequency, the green areas are quiet. At 44 Hz and 140 Hz, clear room resonances build up, once transversely and once longitudinally. The 44 Hz resonance does not behave "textbook": on the right side it is barely visible. The room has two thin glass doors there, which are obviously acoustically favorable. The next steps should be to investigate which other loudspeaker setups or drive units improve the picture. It is clearly recognizable that the green / blue area can hardly be improved by more power: For the required increase of the sound pressure by approx. 10 dB the power would have to be increased tenfold, which would make the bass in other room and frequency ranges (and outside the room) unbearable.
Measurement details
The measurement should extend over the entire floor space of the room in a grid at ear level. (Later during the evaluation, the diagram thus shows the floor plan of the room). The app automatically determines the microphone positions based on the sound propagation times. This makes the horizontal modes with their respective maxima visible. The more clearly the maximum is visible at a certain point, the more effective is the damping at exactly this point. This gives you concrete comparative values of what attenuation can do at a certain point and you are less dependent on intuition and guesswork.
As a mesh width 1 m has proven itself. Smaller scale fluctuations should be understood as trends as described above. So you can save yourself the trouble of measuring them individually.
The measurement is performed separately on the right and left channel. If subwoofers are used, they should be set "as usual". Even with stereo recordings without a separate bass (LFE) channel, the bass range can be (partially) monophonic mixed. This can cause amplifications and cancellations between both loudspeakers, which would be detected by further measurements, where several loudspeakers are driven at the same time. According to my personal experiences one ends however thereby fast in the "curse of the many parameters", if one does not follow a firm procedure. A suggestion for this can be found in the documentation for the app "Subwoofer Optimizer".
Evaluation details
Above the diagram there is a slider for selecting the frequency. The "All Frequencies" vs. "Room Modes" toggle to the left controls the behavior of the slider. "All frequencies" allows the free selection of the frequency, "Room modes" offers some "especially suspicious" frequencies with large level differences depending on the room position.
If several channels (R, L...) or several loudspeaker setups were measured, a corresponding selection option is displayed in the lower area:
- All speakers (max. SPL of ...) shows a first overview. Room modes are recognisable, no matter by which speaker in which position they are excited. The app uses all measurements for each microphone position (right and left channel, if present, several speaker positions) and displays the maximum measured sound pressure. (The measurements are automatically levelled against each other).
- All positions of spkr. ... works like the first point, but is limited to the respective channel (only right and only left channel). In this way, it can be determined whether certain modes are excited by a single loudspeaker.
- Single pos. of spkr. ... is finally limited to a set-up of a specific loudspeaker. In this way, it can be determined whether certain modes are excited by a single loudspeaker in a particular set-up.
The impulse response - technical background
Frequency response and impulse response are Fourier transformed to each other. In the examples above, filters were used in both the frequency and time domains. The Fourier and Hilbert transforms of these filters produce artifacts that must not be mixed with the physical properties of the system under study: Filters in the frequency domain can be seen as a kind of transient in the temporal domain and vice versa. This is called filter ringing and also occurs in linear systems, so technically it has a different origin than "normal ringing" due to nonlinearities.
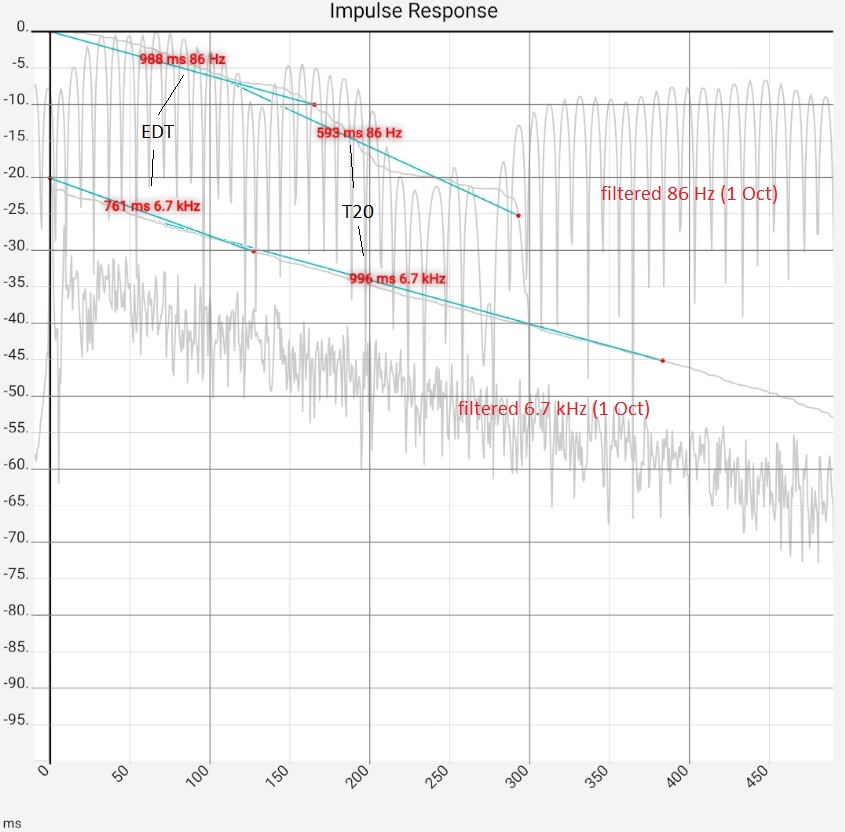
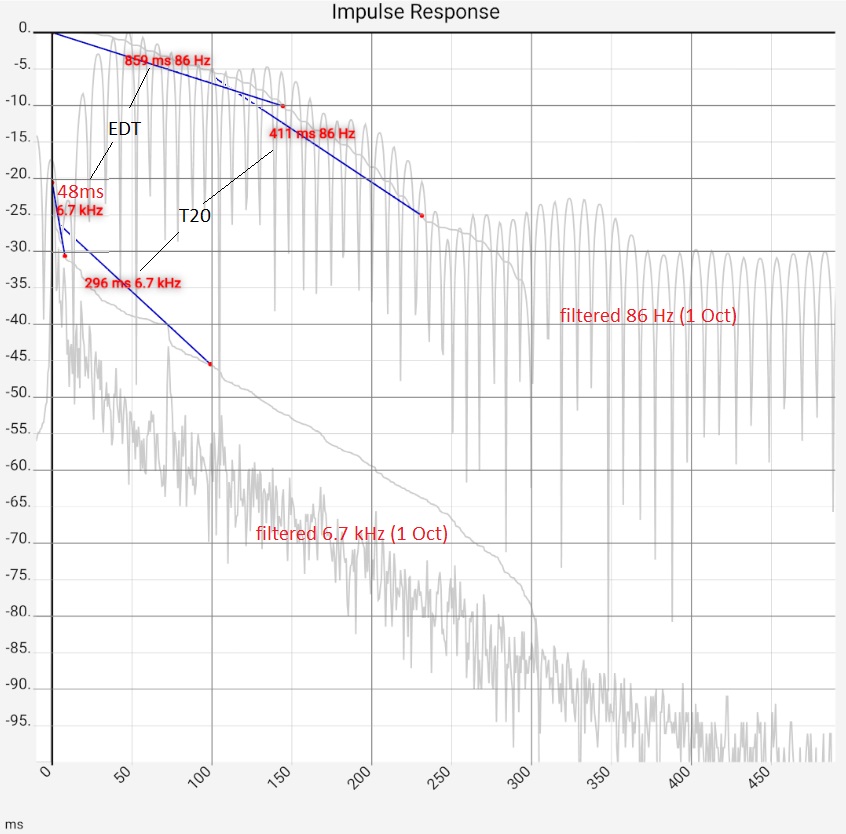
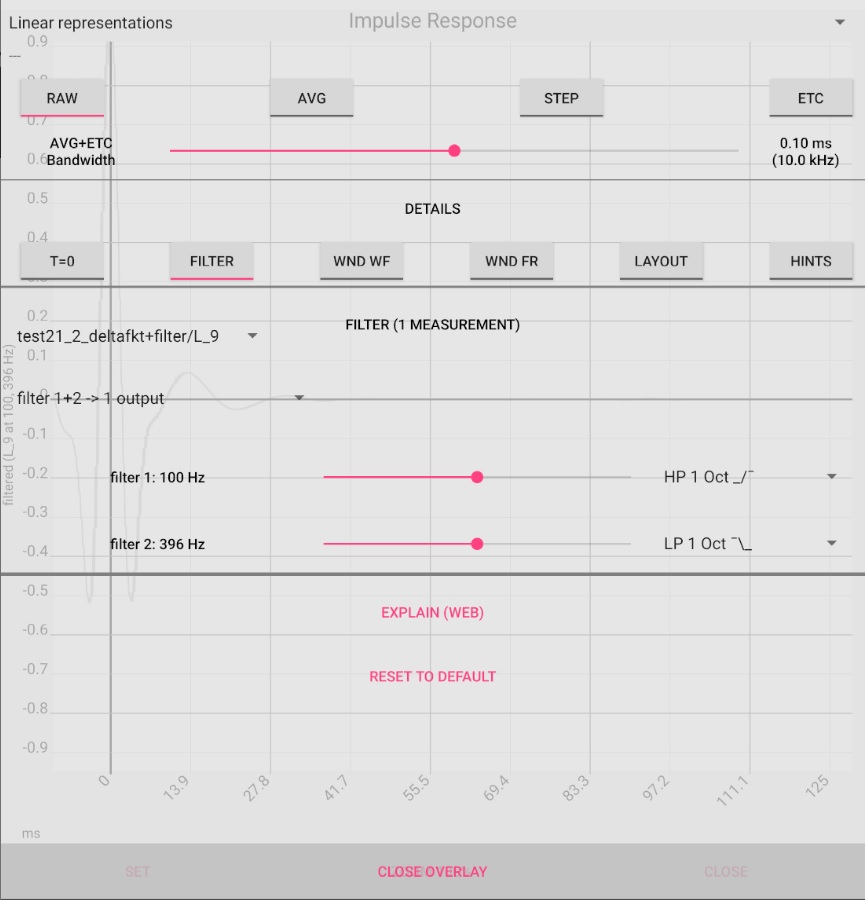
The examples were generated in the app by replacing the measured microphone signal with the logsweep. This was used to simulate an ideal system that accurately reproduces the logsweep. Filtering of the impulse response is done in the [IMP RESP] view by activating [FILTER]. In some cases the logsweep was additionally edited by wave editor (see tables).
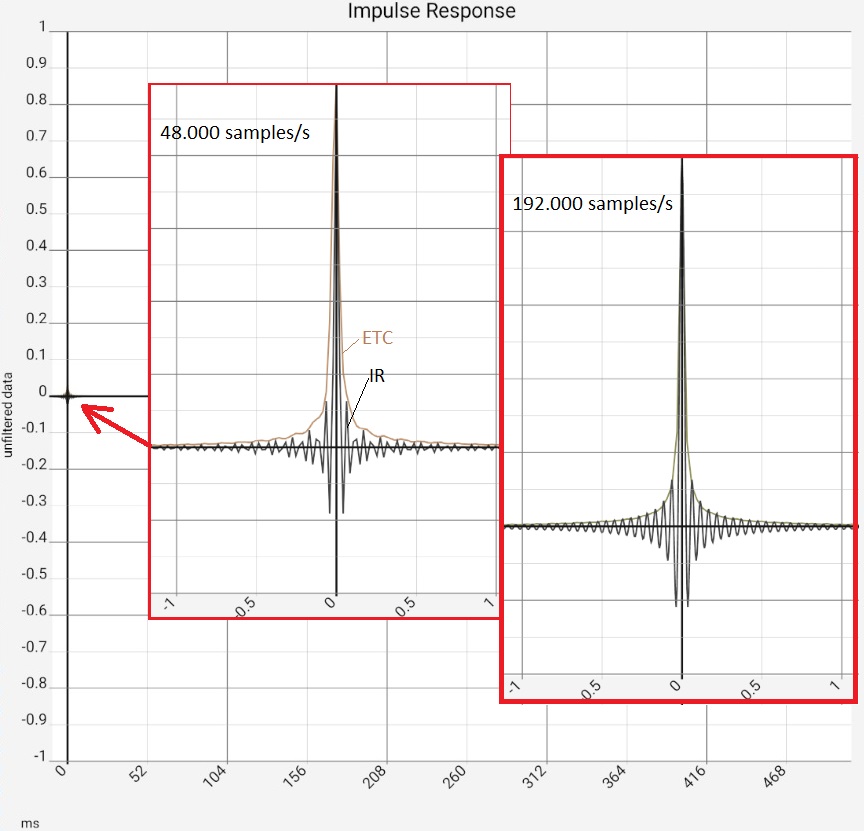
The following table shows artifacts caused by different sample rates and limiting the frequency response at 20 kHz:
The impulse response shows in the normal view hardly recognizable, but after zooming of the time axis clear deflections with approx. 0.05 ms period duration, thus roughly 20 kHz. These do not depend on the sample rate. It can only be seen that the image becomes clearer at 192 kHz. The unsmoothed Hilbert transform (ETC for Energy Time Curve) forms the envelope.
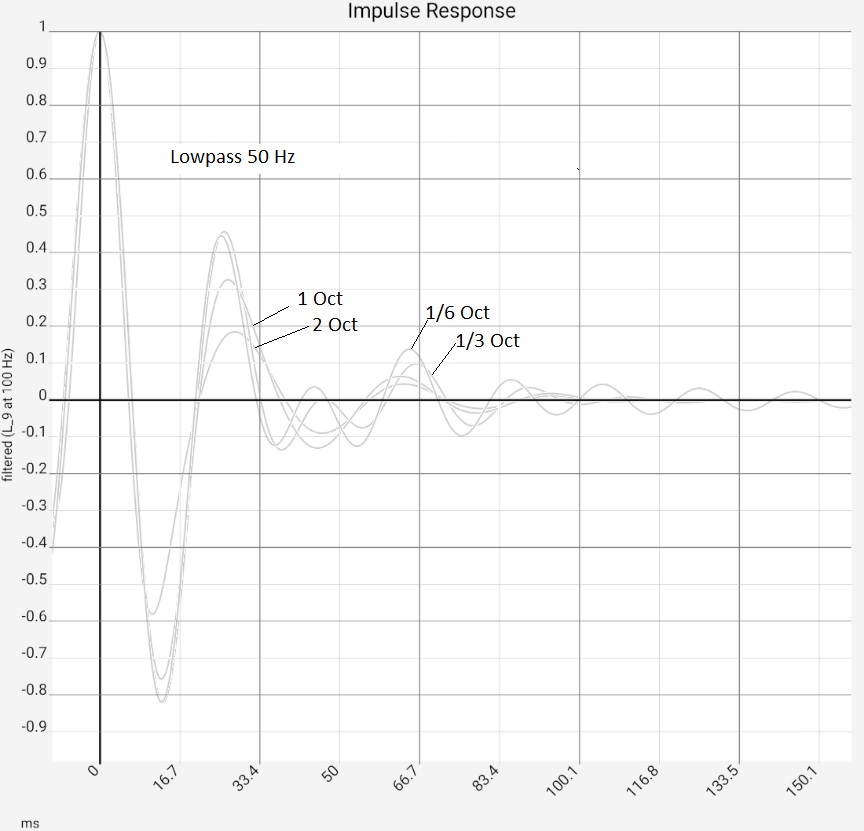
For comparison, several filters with different slopes were set at 50 Hz. Here, an analogous picture appears in the corresponding time scale. Thus, the visible artifact is most likely due to the frequency response being limited at 20 kHz. An ideal filter, which would cut off abruptly at the angular frequency $\omega_g$, would have the impulse response $\sin(\omega_g t)/t$ and the zero-crossings would be a bit further out at 10 ms (web search: si-filter, Küpfmüller lowpass). The filters used here have a finite bandwidth and therefore decay faster. A roloff bandwidth of 1/3 octave allows the impulse response to decay to a non-interfering level after 5 to 10 periods. To cover this additional 1/3 octave, the measurement data would have to go up to 25 kHz.
Conclusion: Vibrations in the range of the Roloff frequency are artifacts and no indication for defects or inaccuracies in the used equipment or Consequences of whimsical "graded reflective" objects. If they occur during the examination of reflections one should classify them accordingly and not be bothered. For elimination, a Roloff well above the 20 kHz range would be necessary. Since the usual measurements do not provide any data there, this would only be possible with computational tricks.
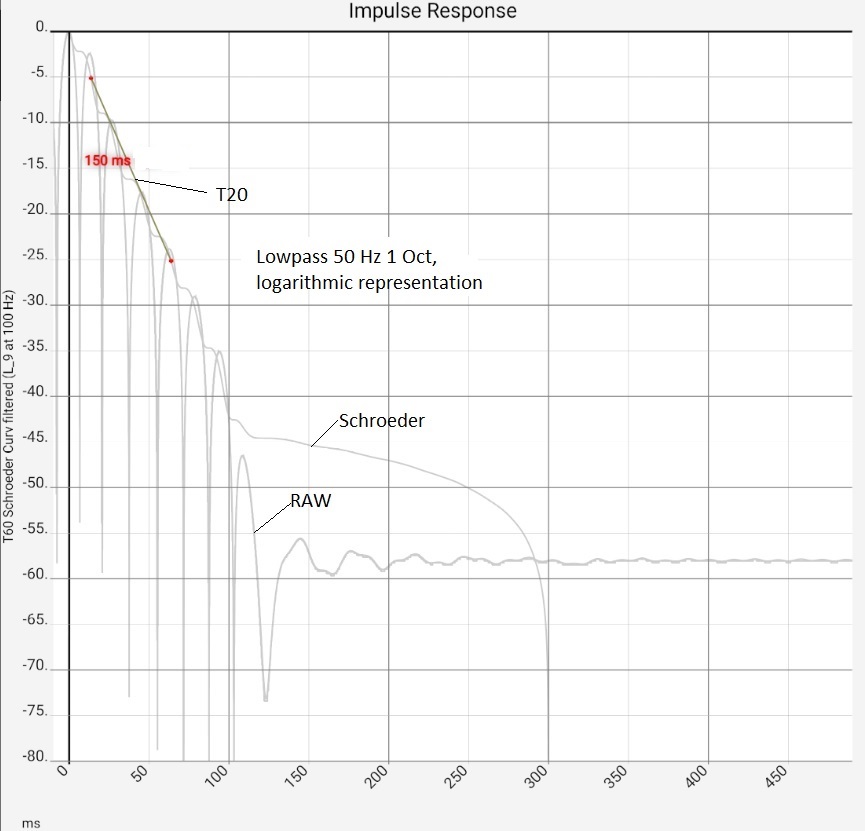
The fourth image shows the same data logarithmically (in dB) and the corresponding T60 value. Even if the impulse response used has a reverberation time close to zero, the calculated reverberation time after filtering is not zero. In the figure, T20 (i.e. T60 determined from a drop of 20 dB) has the value 150 ms at 1 octave bandwidth and 50 Hz corner frequency. At a bandwidth of 1/6 octave, the value increases to 327 ms. In practice, if the filters are set too narrowly, the filter ringing can reach the order of magnitude of the useful signal [Goertz 2020]. This must not be forgotten when investigating narrow frequency bands.
Different speakers and rooms
| Description | Frequency und Implse Response - Click on image to enlarge | Hifi-Apps Ergebnis und Kommentar | |
PC R5x5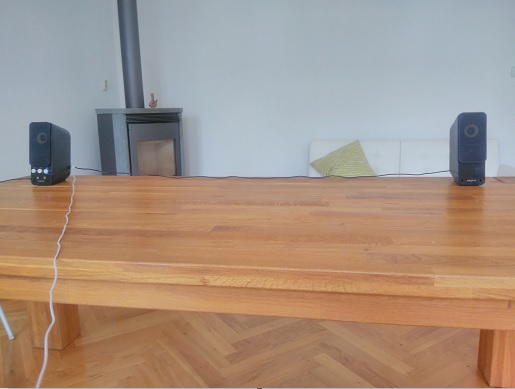 |
Small PC speakers on a table in an almost undamped square room (5m x 5m). | 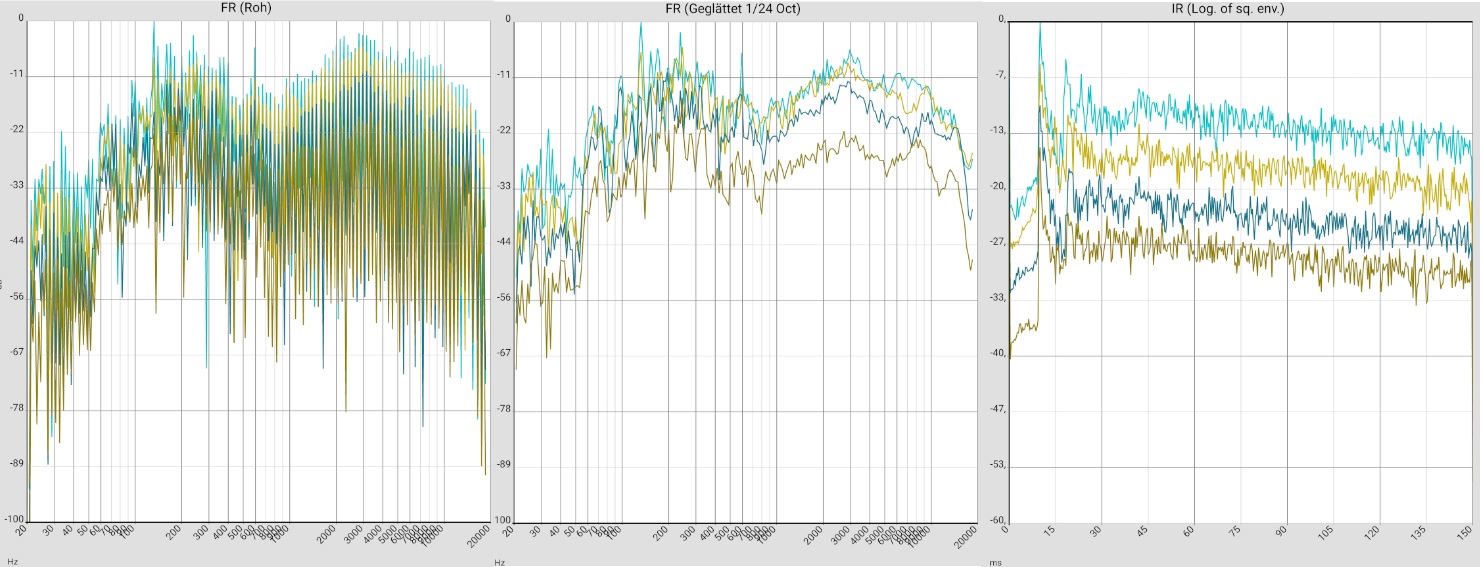 |
2019-08-29_INT.PCSPKR.WZ5X5 (Deutsch) |
PC OFFICE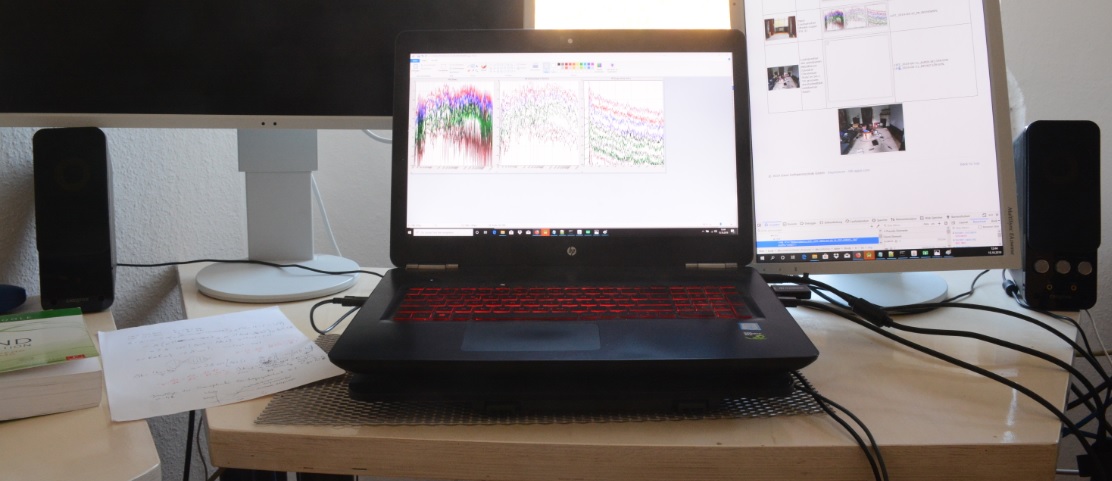 |
Small PC speakers in the office. | 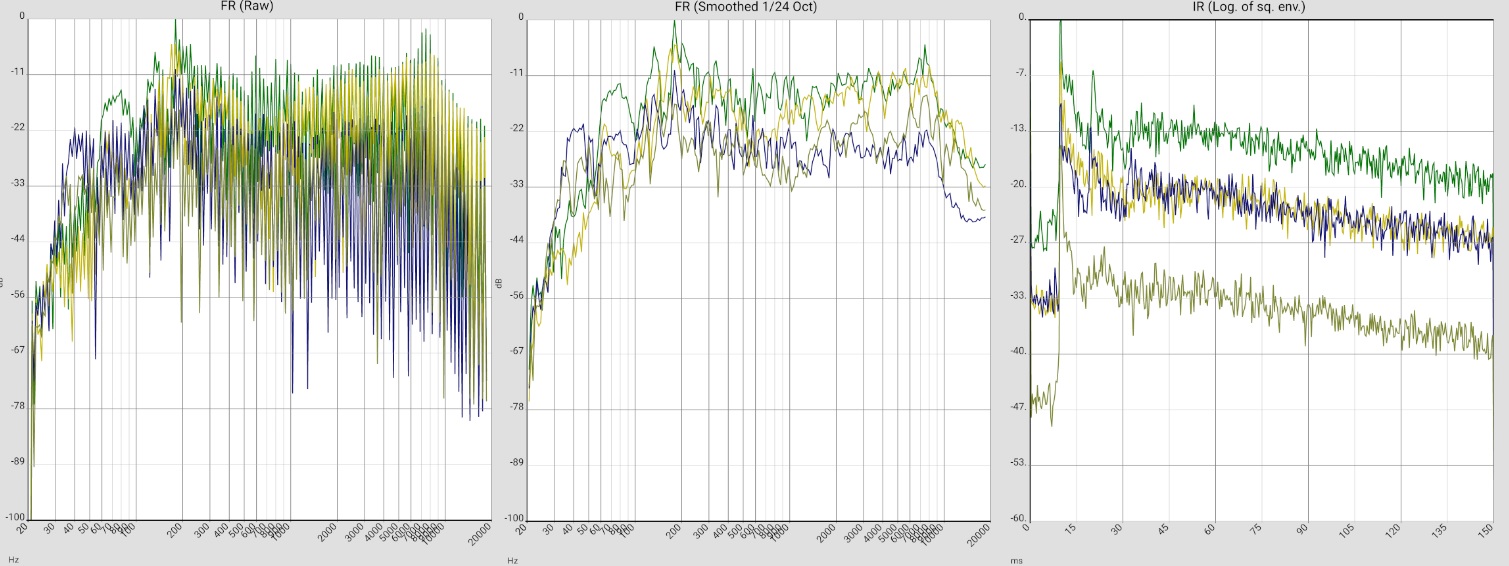 |
2019-08-13_TAB_PC_SPKR_CABLE_CONNECTED LIST_2019-08-13_TAB_PC_SPKR_BT_CONNECTED |
GAUS + ABSORBER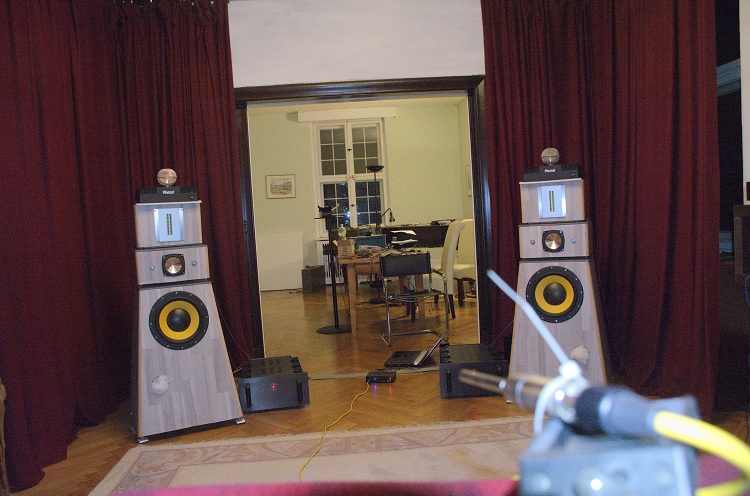 |
Modular self-built with plasma tweeters (Magnat MP 02) - damping with acoustic curtains. | 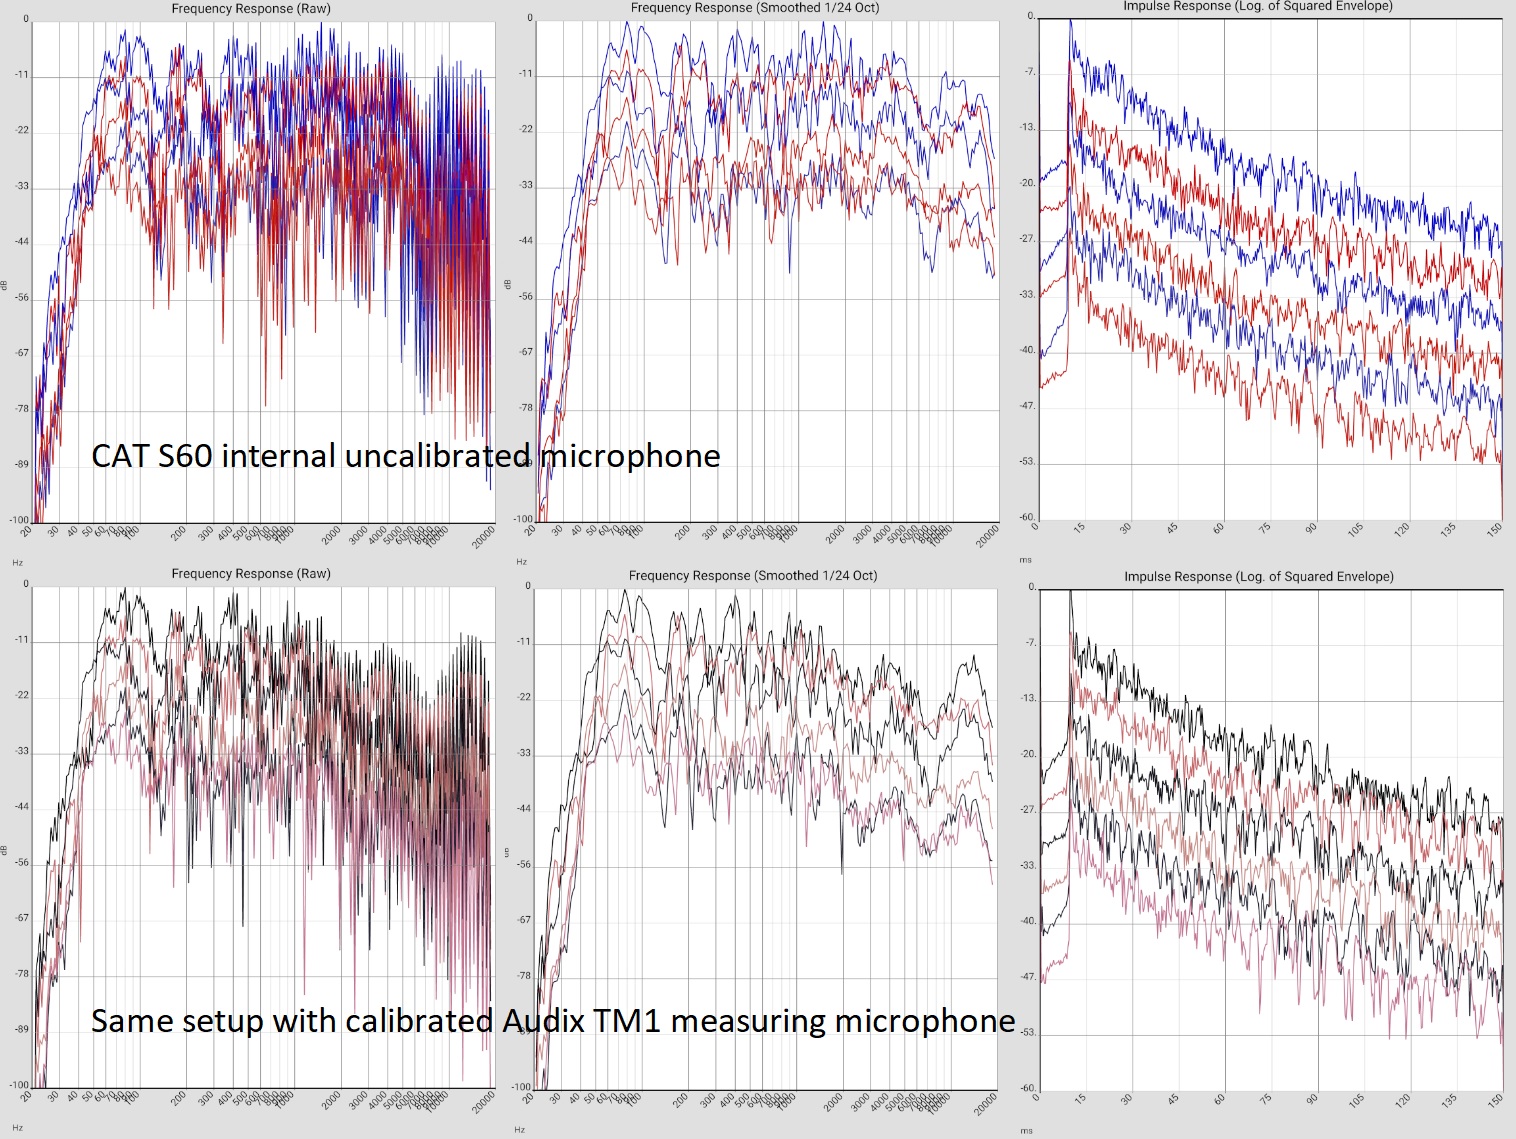 |
LIST_2019-08-19_INT.GAUS.VORH.OFFEN LIST_2019-08-19_INT.GAUS.VORH.ZU LIST_2019-08-19_AUDIX.GAUS.VORH.OFFEN LIST_2019-08-19_AUDIX.GAUS.VORH.ZU. |
ML + ABSORBER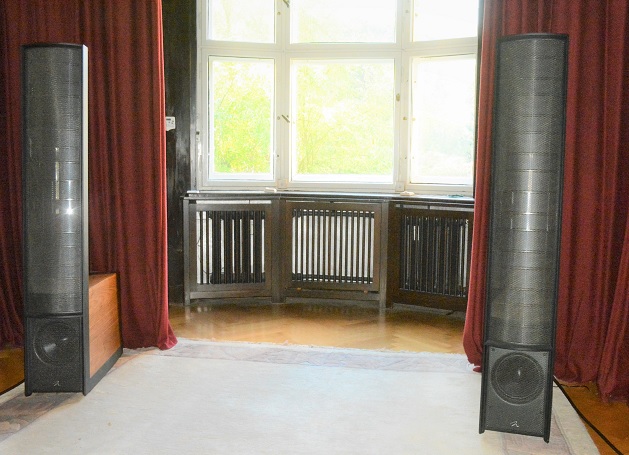 |
Dipole speaker (Martin Logan ESL 9) | 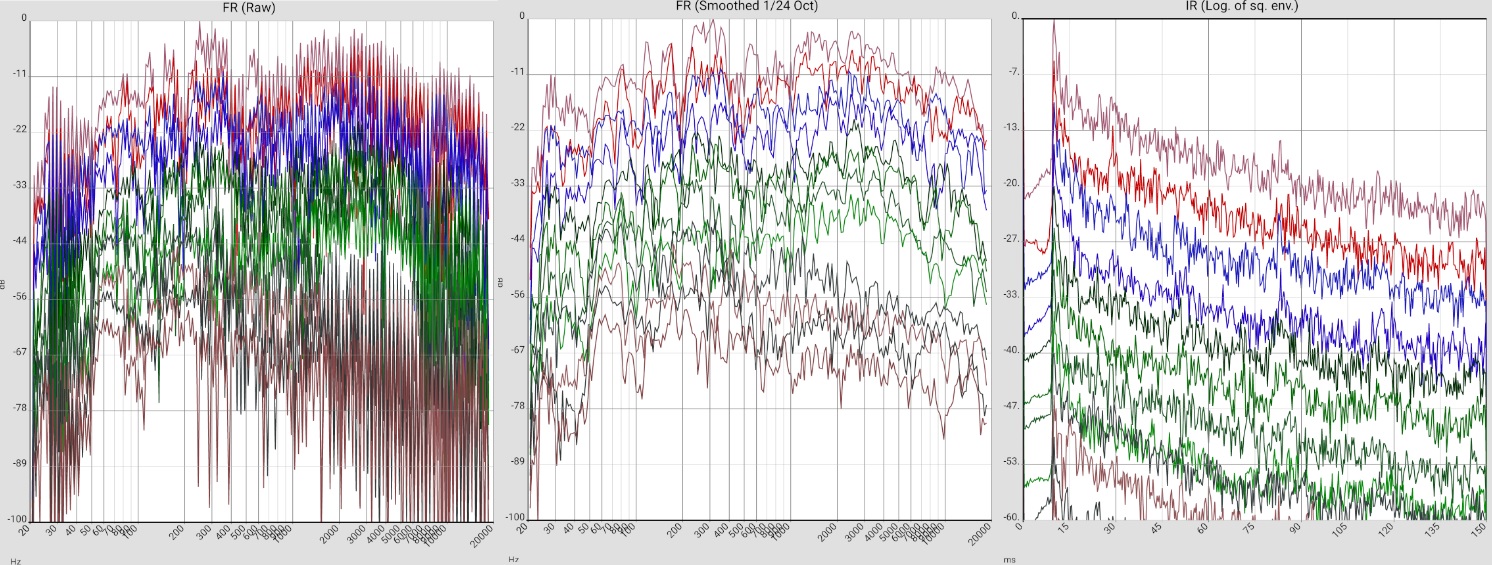 |
2019-09-22_ML_INT_XXX |
QU50 LIV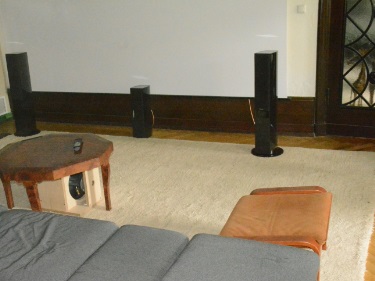 |
Floorstanding loudspeaker (Quadral Chromnium Style 50) in 5m x 7m average furnished room | 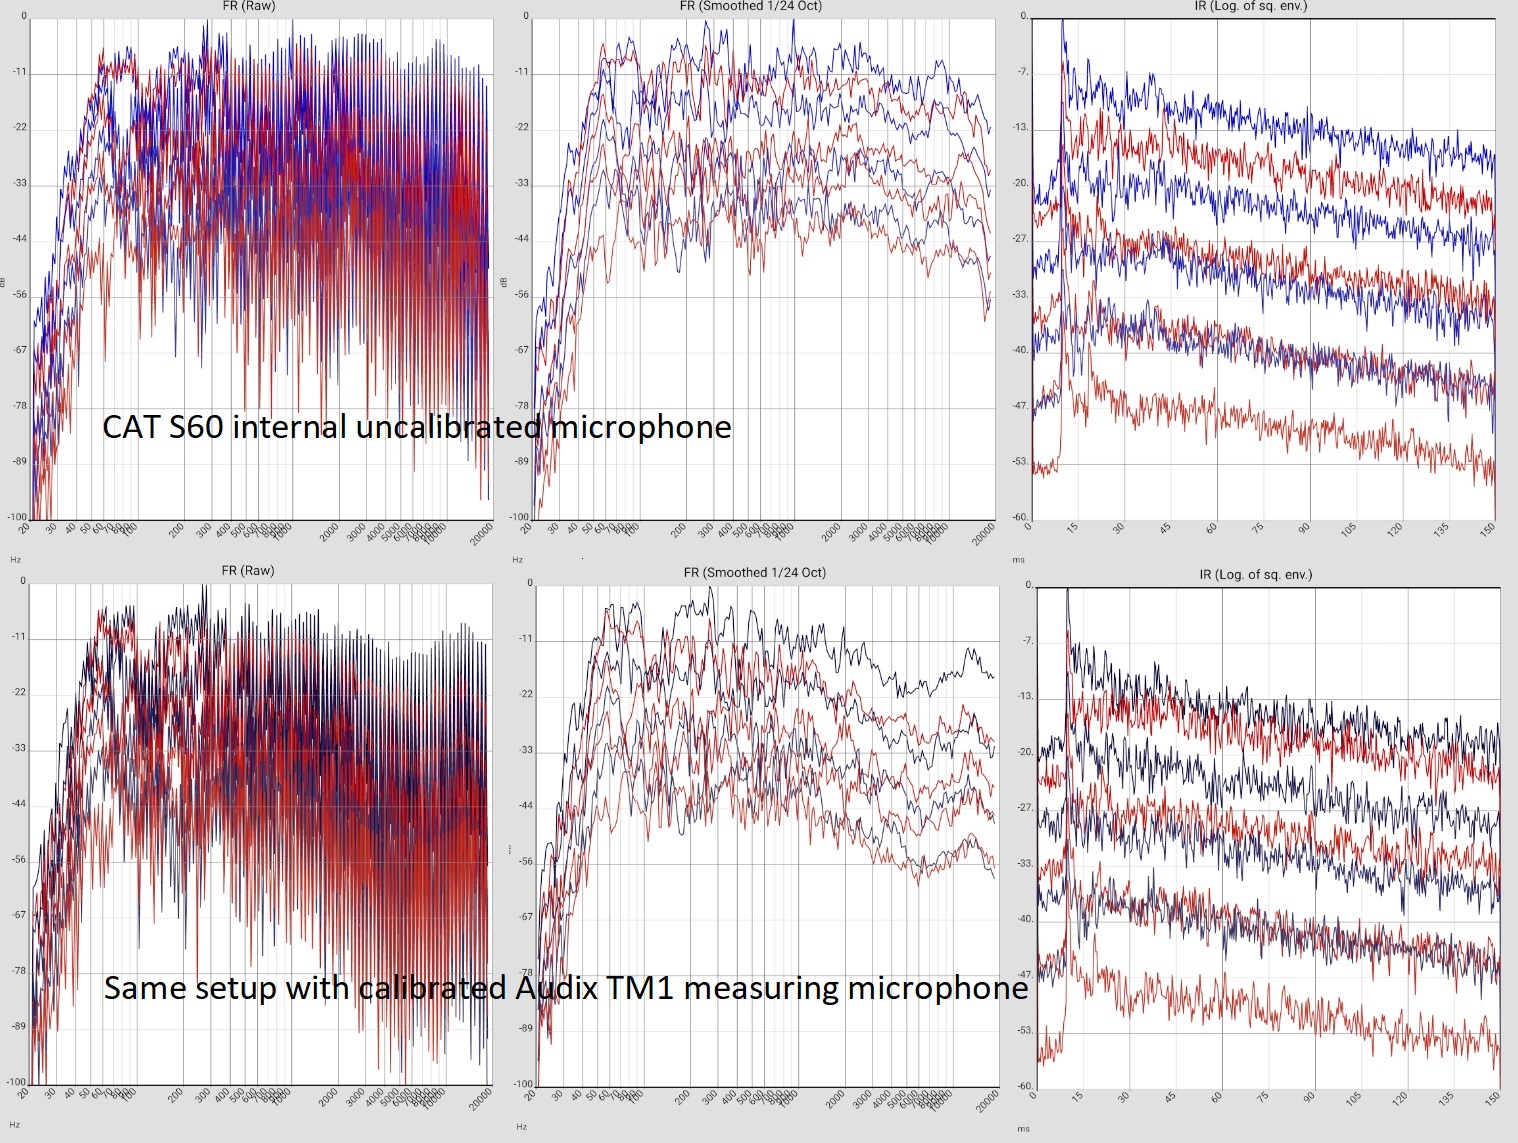 |
LIST_2019-06-11_AUDIX.WZ.STR-GTN LIST_2019-06-11_INT.WZ.STR-GTN. |
QU30 BA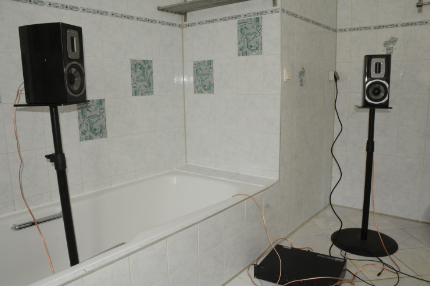 |
No worst-case scenario: Quadral Chromnium Style 30 in a bathroom. | 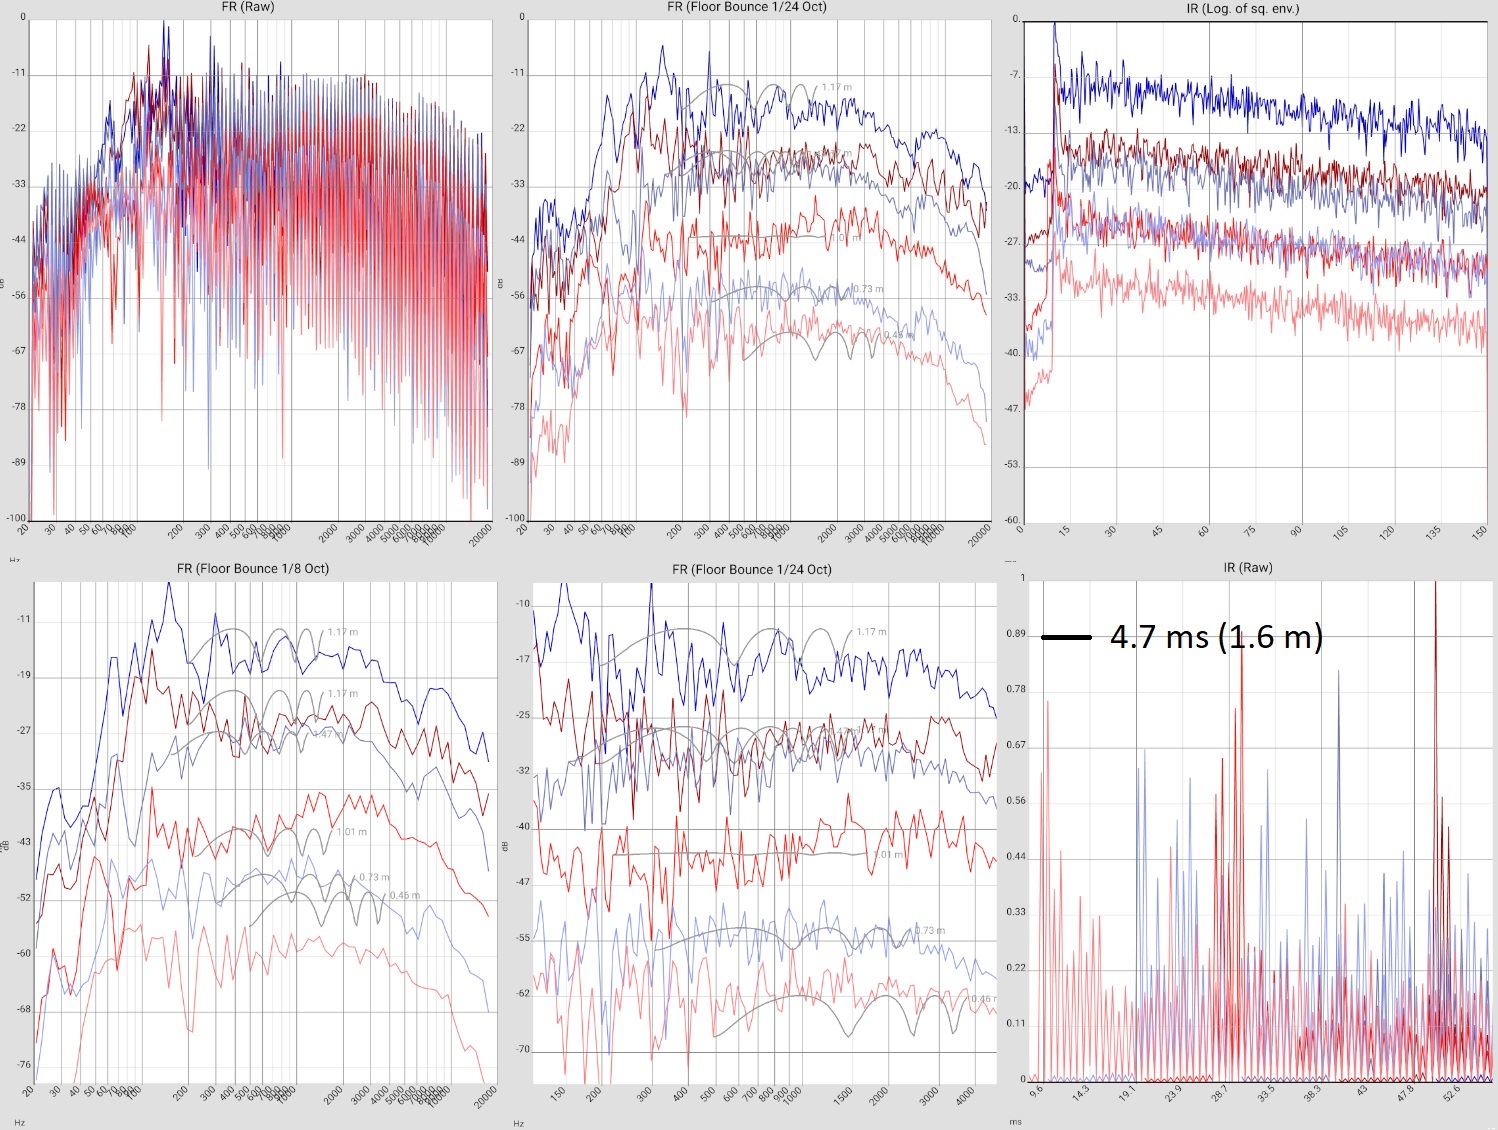 |
LIST_2019-10-17_INT_QUADRAL_BAD |
QU30 R5x5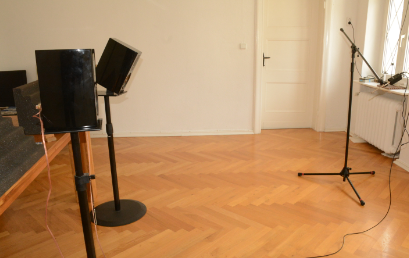 |
Artificial provocation of floor reflections (right speaker tilted to the floor) | 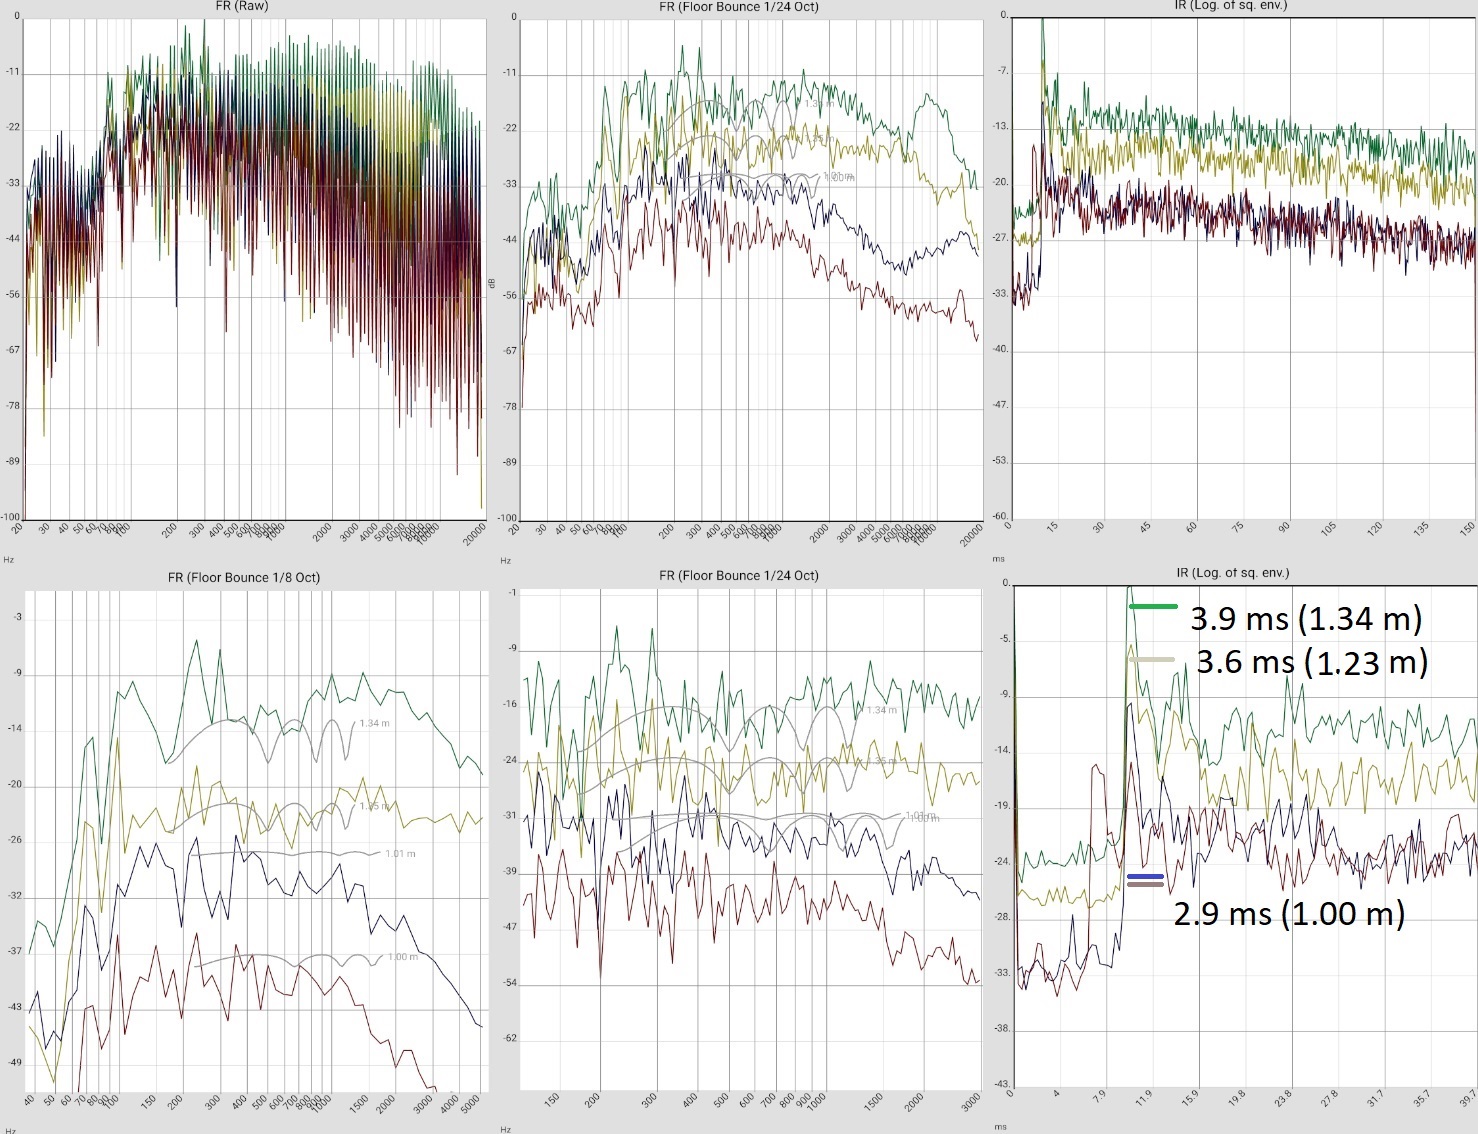 |
LIST_2019-10-17_AUDIX_W5_FB. LIST_2019-10-17_INTW5_FLOORBOUNCE. |
MARTION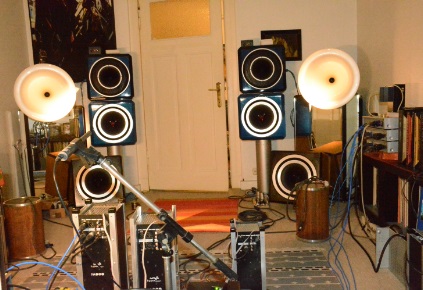 |
Horn loudspeaker MARTION Bullfrog aktiv | 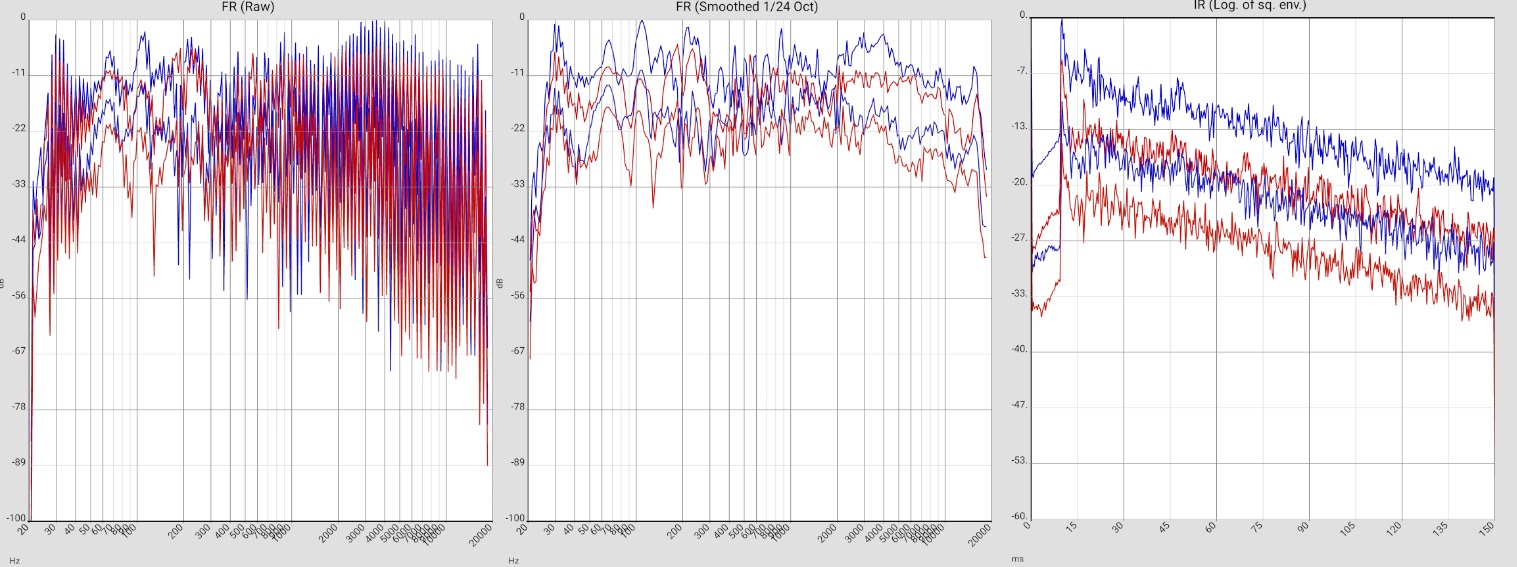 |
LIST_2019-10-30_MARTION_BULLFROG |
Literatur
[Blauert 1974, Wikipedia] Wikipedia Artikel "Blauertsche Bänder": https://de.wikipedia.org/wiki/Blauertsche_B%C3%A4nder
[Defrance 2009] G. Defrance, L. Daudet and J-D. Polack: Using Matching Pursuit for estimating mixing time within Room ImpulseResponses. DOI:10.3813/AAA.918239 https://www.institut-langevin.espci.fr/IMG/pdf/defrance2009.pdf
[Fuchs 2019] Helmut Fuchs, Vortrag TU-Berlin 2019.
[Goertz 2020] Anselm Goertz: Seminat "Studioakustik und Monitorlautsprecher" 2020 TU-Berlin.
[IRZU FFT WAVELETS] IRZU, Research - Category: FFT & WAVELETS https://irzu.org/category/research/fft-wavelets/
[Møller 1974] Møller, Henning: Relevant loudspeaker tests in studios inHi-Fi dealers' demo rooms in the home etc. using 1/3 octave, pink-weighted, random noise. 47th Audio Engineering Society Convention, 1974-02-26/29, Copenhagen (Denmark), https://www.bksv.com/media/doc/17-197.pdf
[Toole 2015] Toole, Floyd E: The Measurement and Calibration of Sound Reproducing Systems, in: Journal of the Audio Engineering Society 63(7/8):512-541, August 2015, http://www.aes.org/e-lib/download.cfm/17839.pdf?ID=17839
[Usher 2010] John Usher: "An improved method to determine the onset timings of reflections in an acoustic impulse response". The Journal of the Acoustical Society of America 127, EL172 (2010); https://doi.org/10.1121/1.3361042 https://asa.scitation.org/doi/10.1121/1.3361042
[Zehner Ringversuch] Markus Zehner: Ringversuch Nachhallzeit http://www.zehner.ch/lab/ringversuch4.html
[Protheroe 2013] Daniel Protheroe, Bernard Guillemin: "3D impulse response measurements of spaces using aninexpensive microphone array". Toronto, Canada International Symposium on Room Acoustics 2013 http://www.iris.co.nz/media/14459/ISRA2013.pdf
